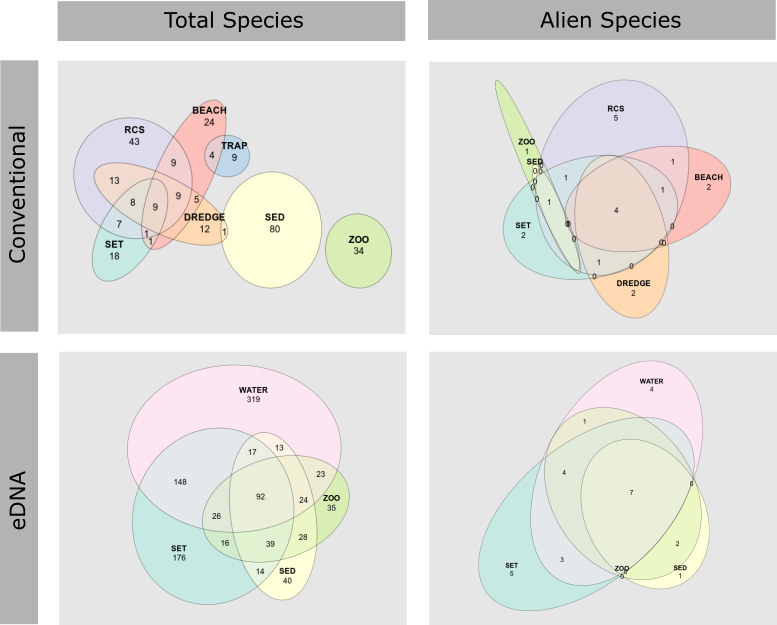
Figure 26 . Venn diagram showing the number of total (left) and alien (right) species detected by conventional (upper) and DNA-based (lower) methods coloured by sampling method. For eDNA data, data was limited to only those species belonging to phyla investigated using conventional methods (Annelida, Arthropoda, Bryozoa, Chaetognatha, Chlorophyta, Chordata, Cnidaria, Ctenophora, Echinodermata, Foraminifera, Mollusca, Nematoda, Nemertea, Ochrophyta, Porifera, Priapulida, Rhodophyta, and Streptophyta).