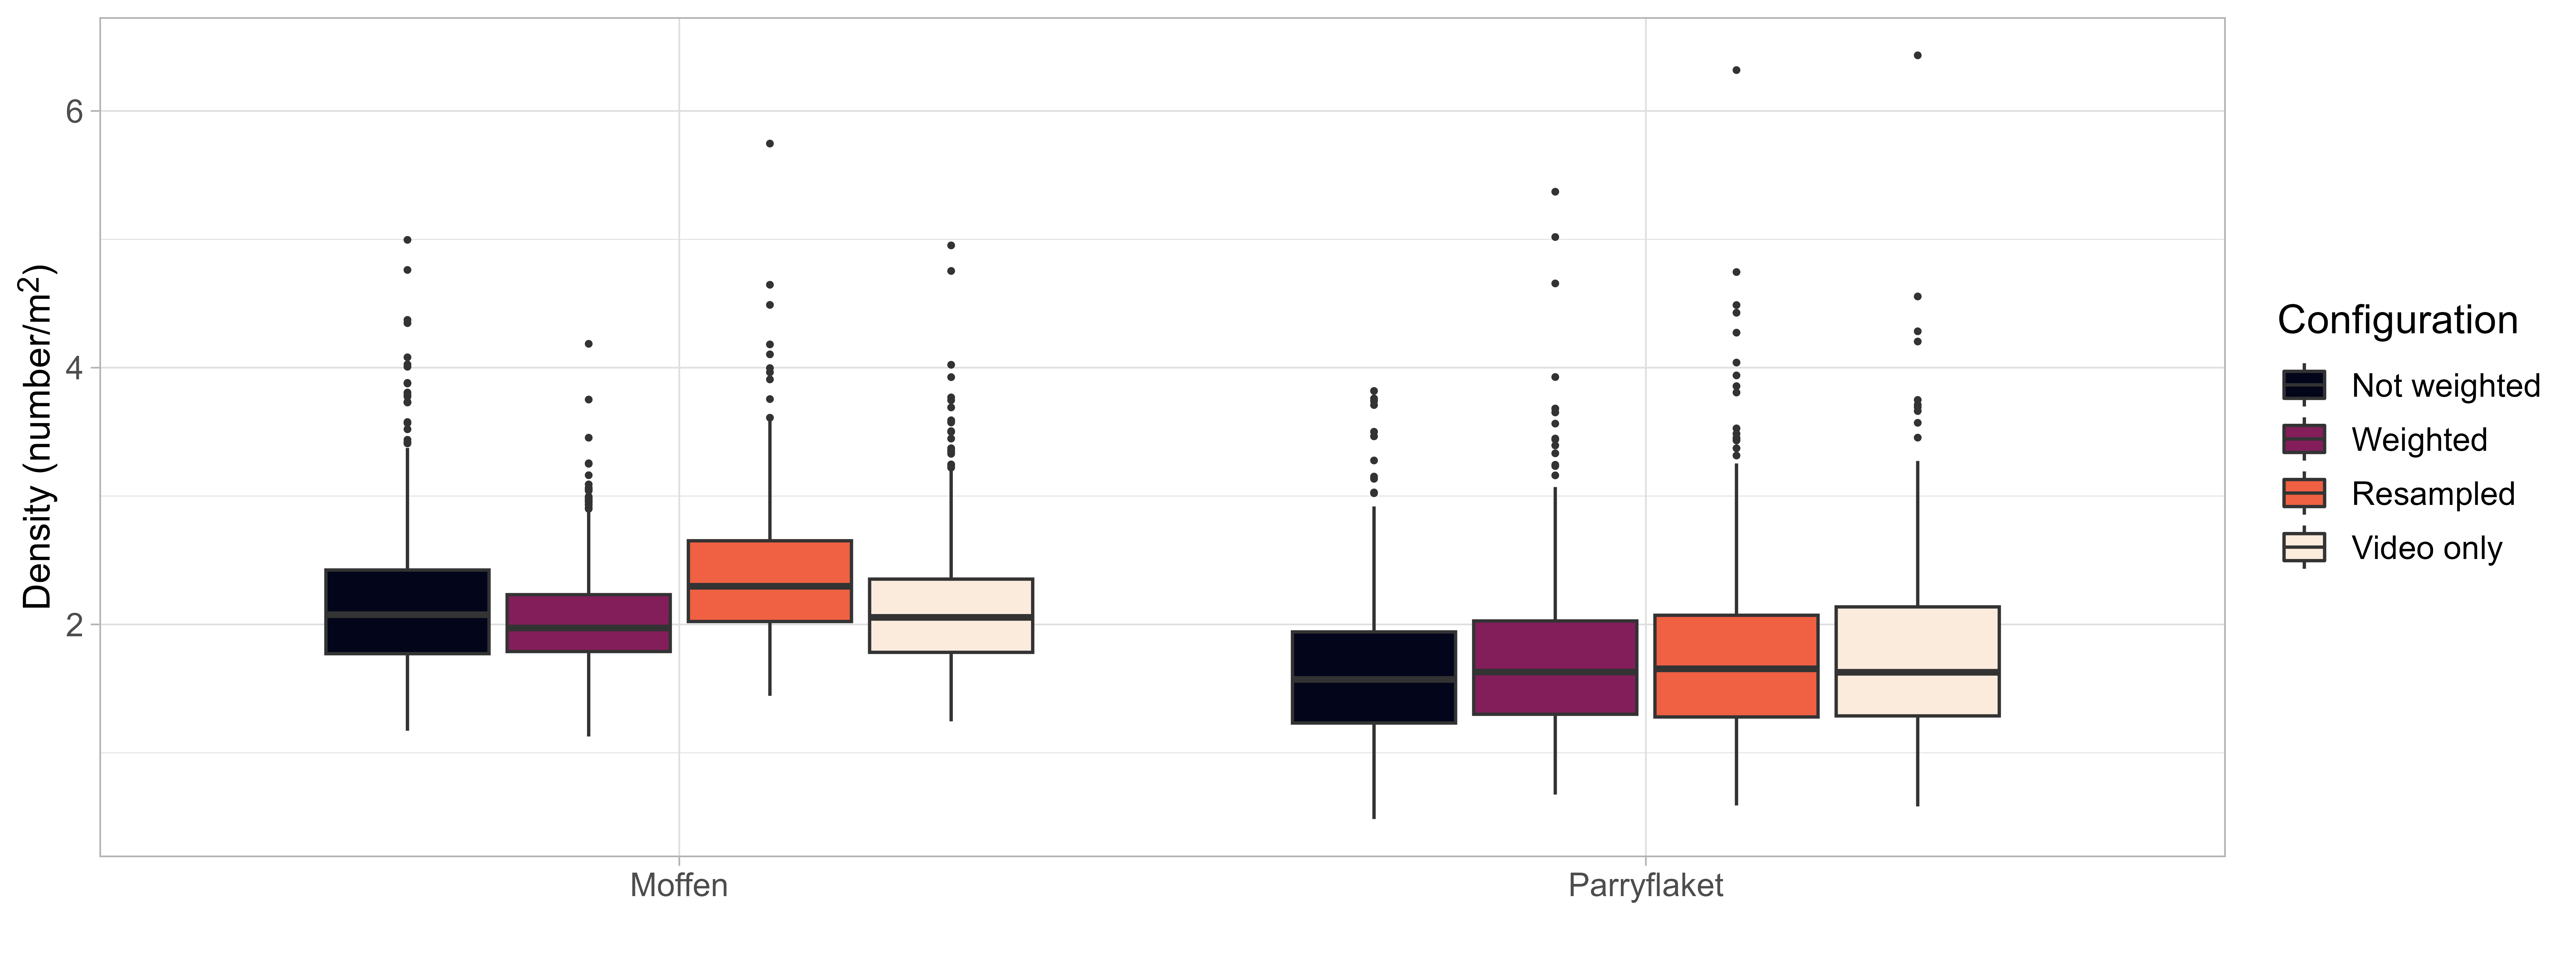
Figure 16: Estimated scallop density on Moffen and Parryflaket beds outside of protected areas. Shown are boxplots of estimated mean density based on 1000 iterations of four different GAMM configurations: 1) using video and dredge data combined (unweighted), 2) video and dredge data weighted with the number of images per station (dredge fixed to 0.5), 3) video and dredge data weighted, with video counts resampled from the estimated count distributions, and 4) video data only as the baseline used in Stokkeland (2023). Each iteration represents a simulated density across the integration grid based on means and standard errors estimated with the spatial GAMM. For resampled abundance estimated, the spatial GAMM was re-fitted in each iteration to the resampled count data. Boxplots show median (solid lines), 25% and 75% percentiles (boxes), 1.5 interquartile range (whiskers), and outliers (dots).