Gå til hovedinnhold
Havforskningsinstituttet
HI
English
<- Tilbake
Søk
Søk
Søk
View page in English
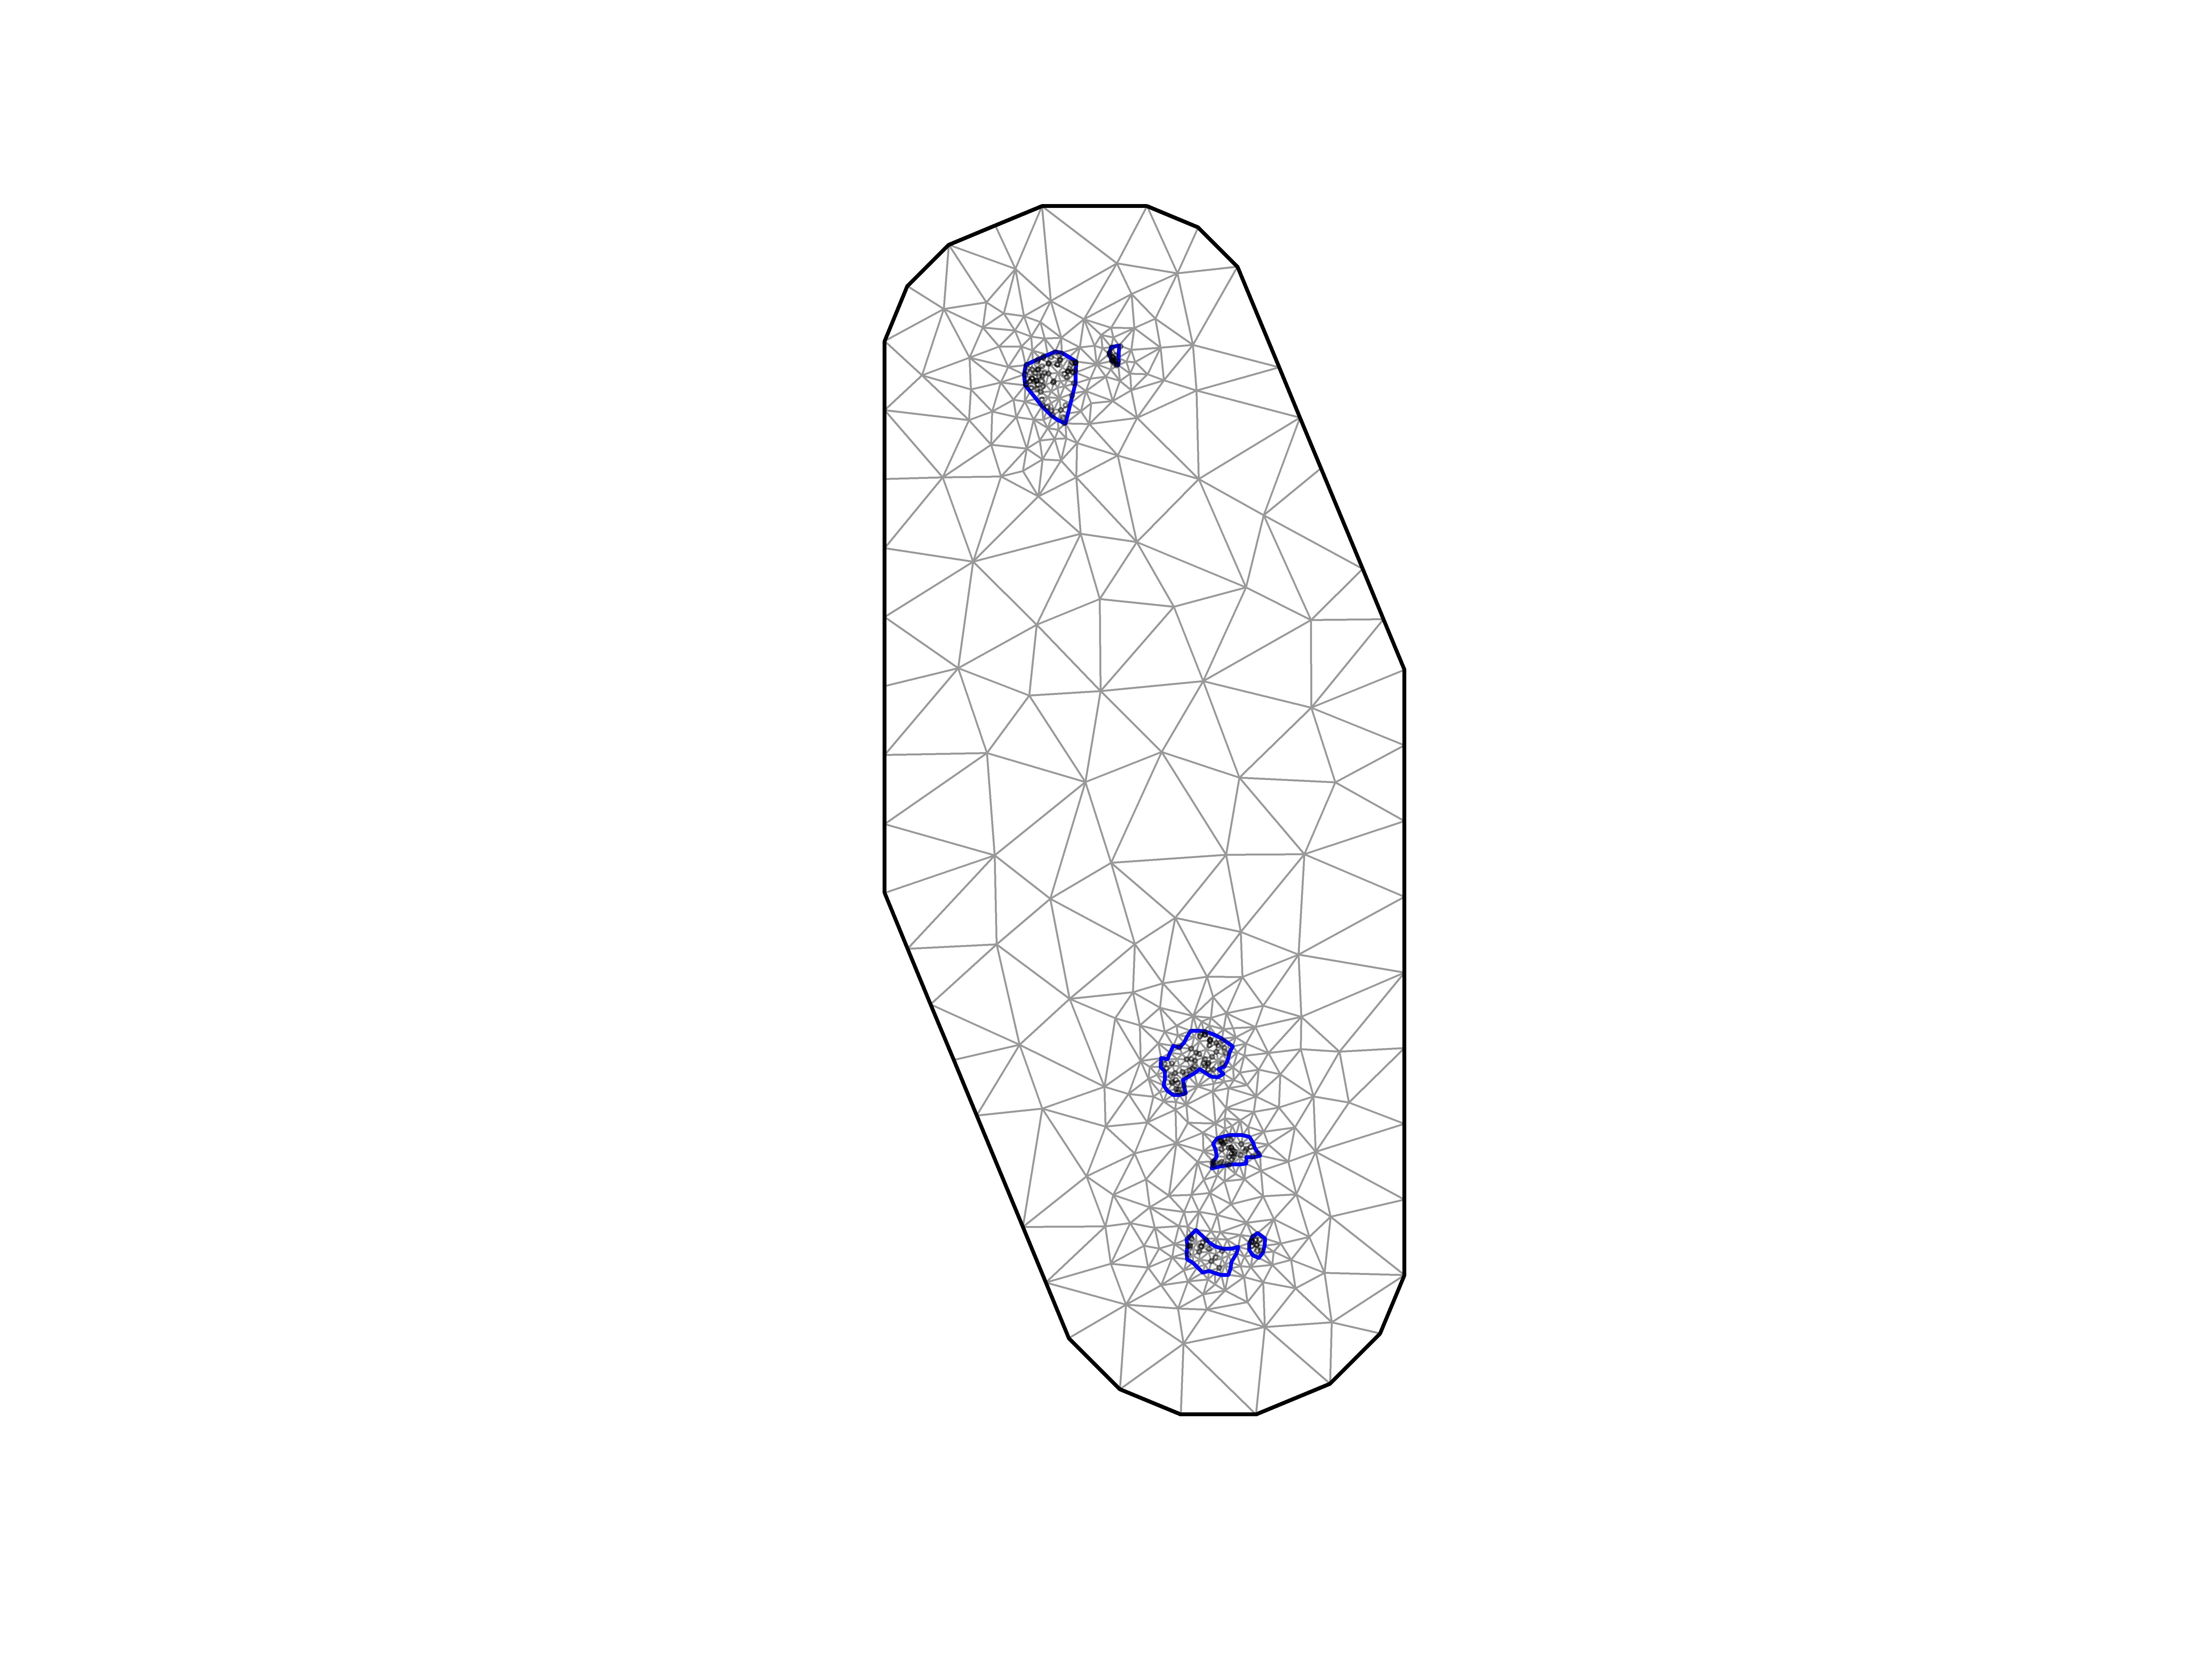
Figur
Fra rapporten:
Survey of Iceland scallop beds north of Svalbard
Figure 20: Mesh used in the spatial GAMM to estimate density. Black lines represent mesh vertices, blue lines inner boundaries of scallop beds, and black circles observed data points.