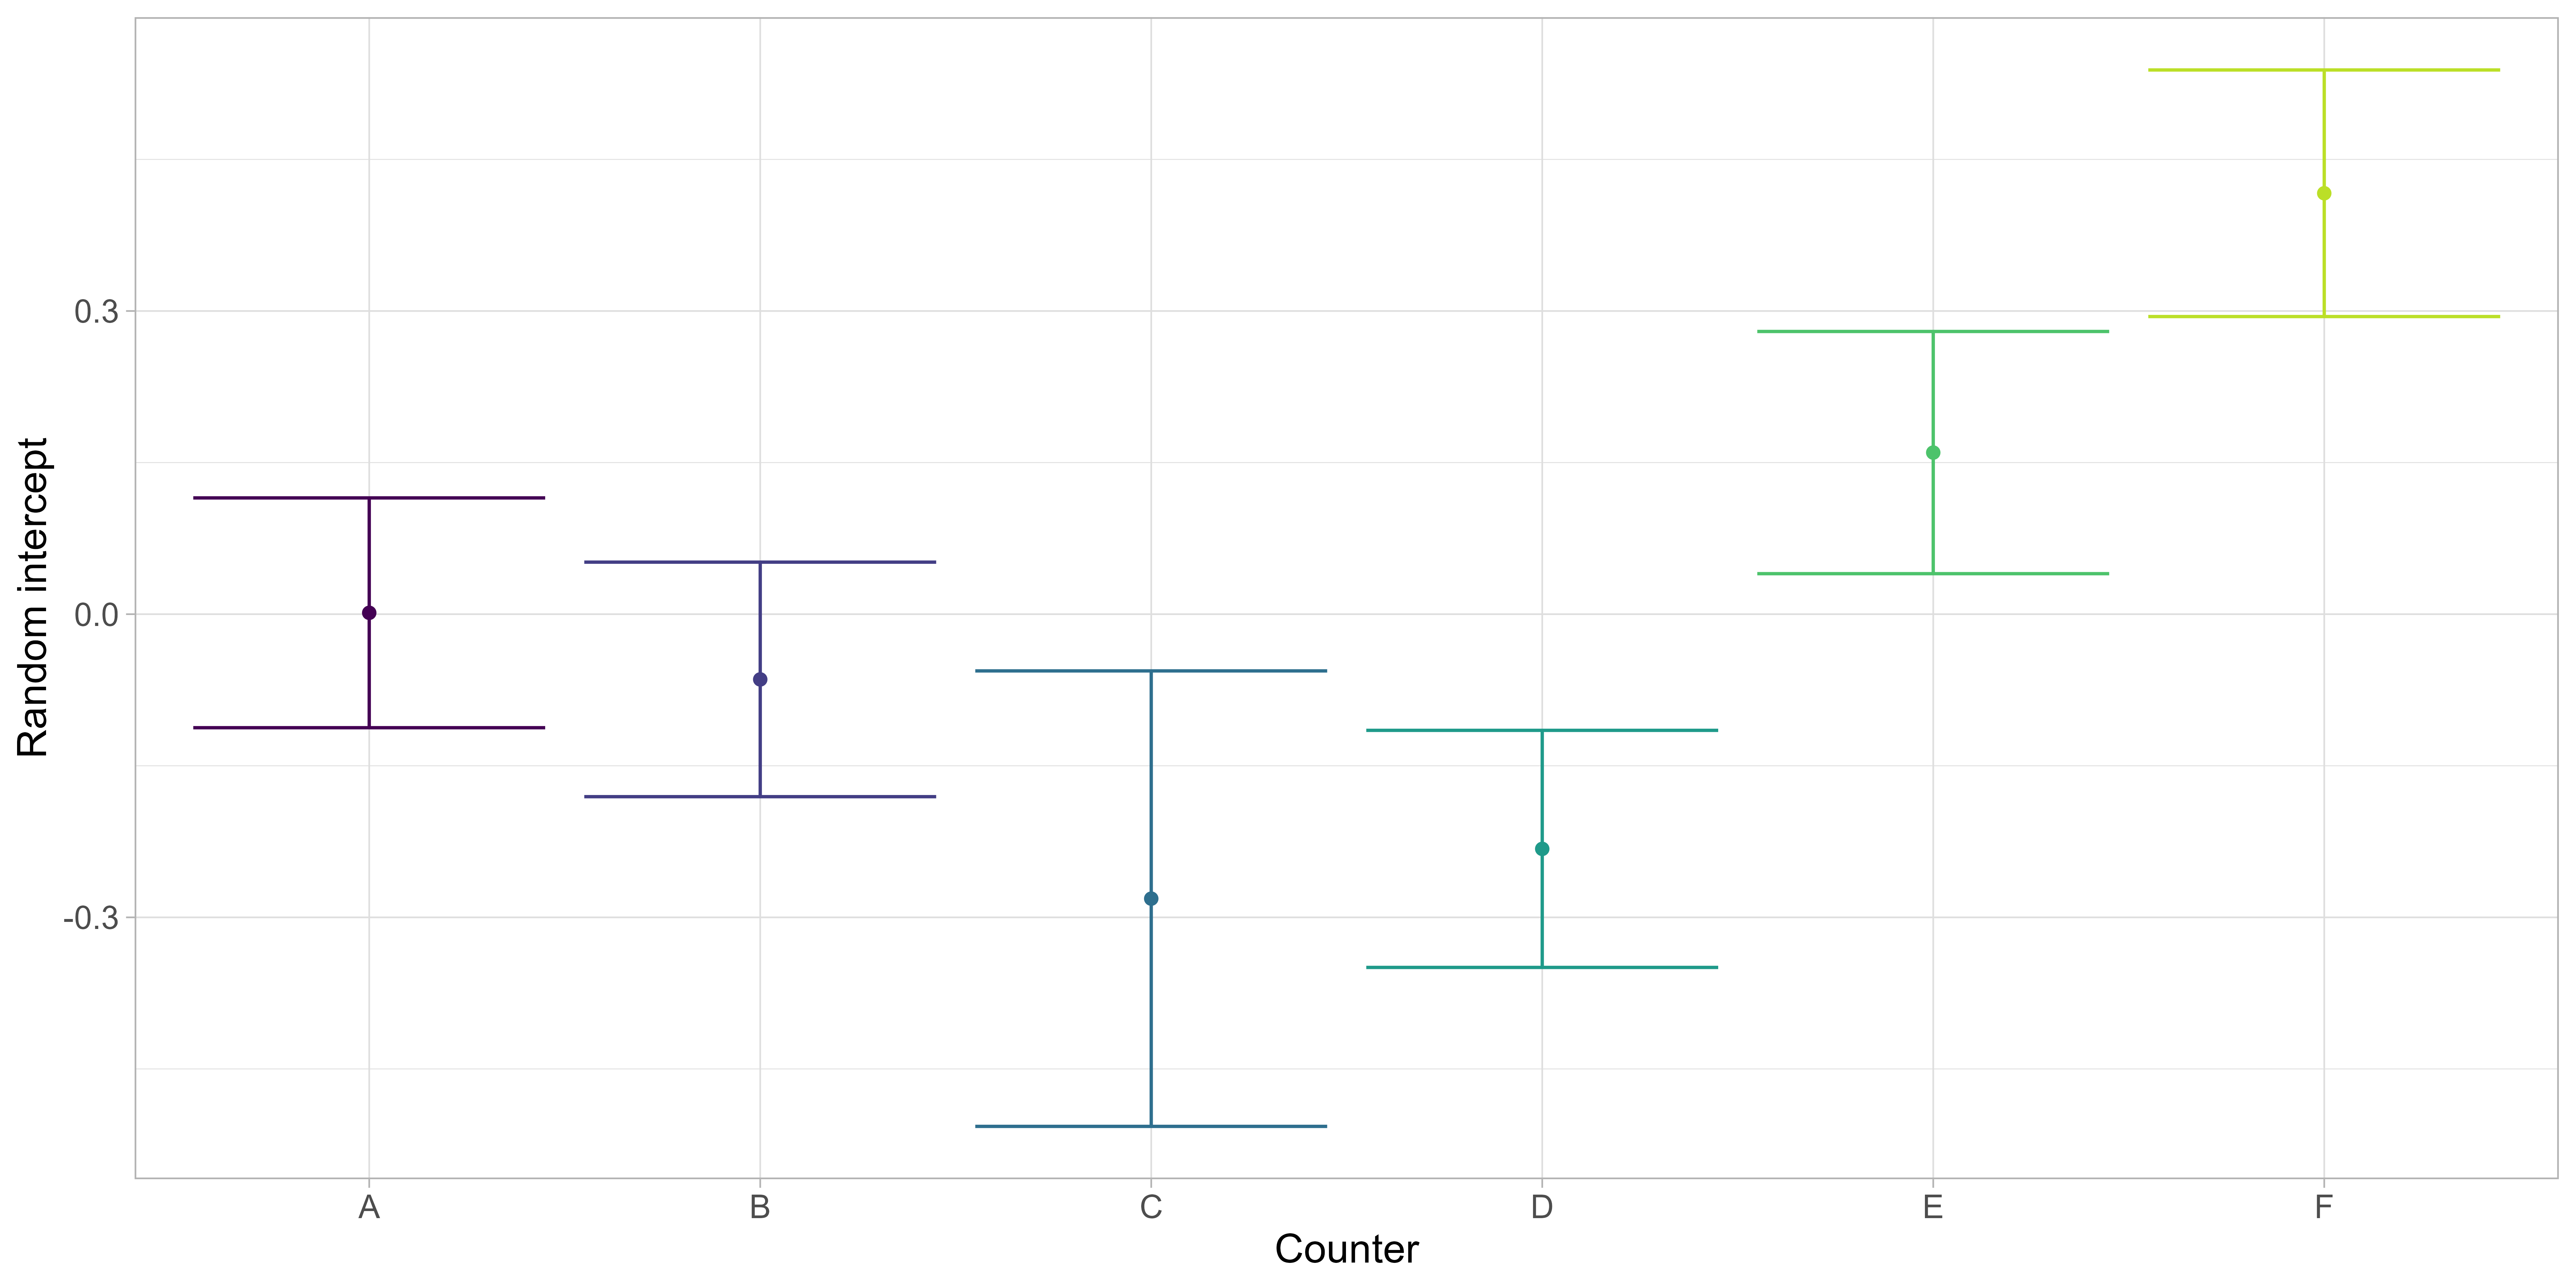
Figure 13: Random counter effect estimated by GLMM. Annotated scallops per image were modelled as a function of station, with counter as random intercept, using a negative binomial error distribution with log-link. Estimated densities are shown as mean (dot) and 95% confidence intervals (error bars).