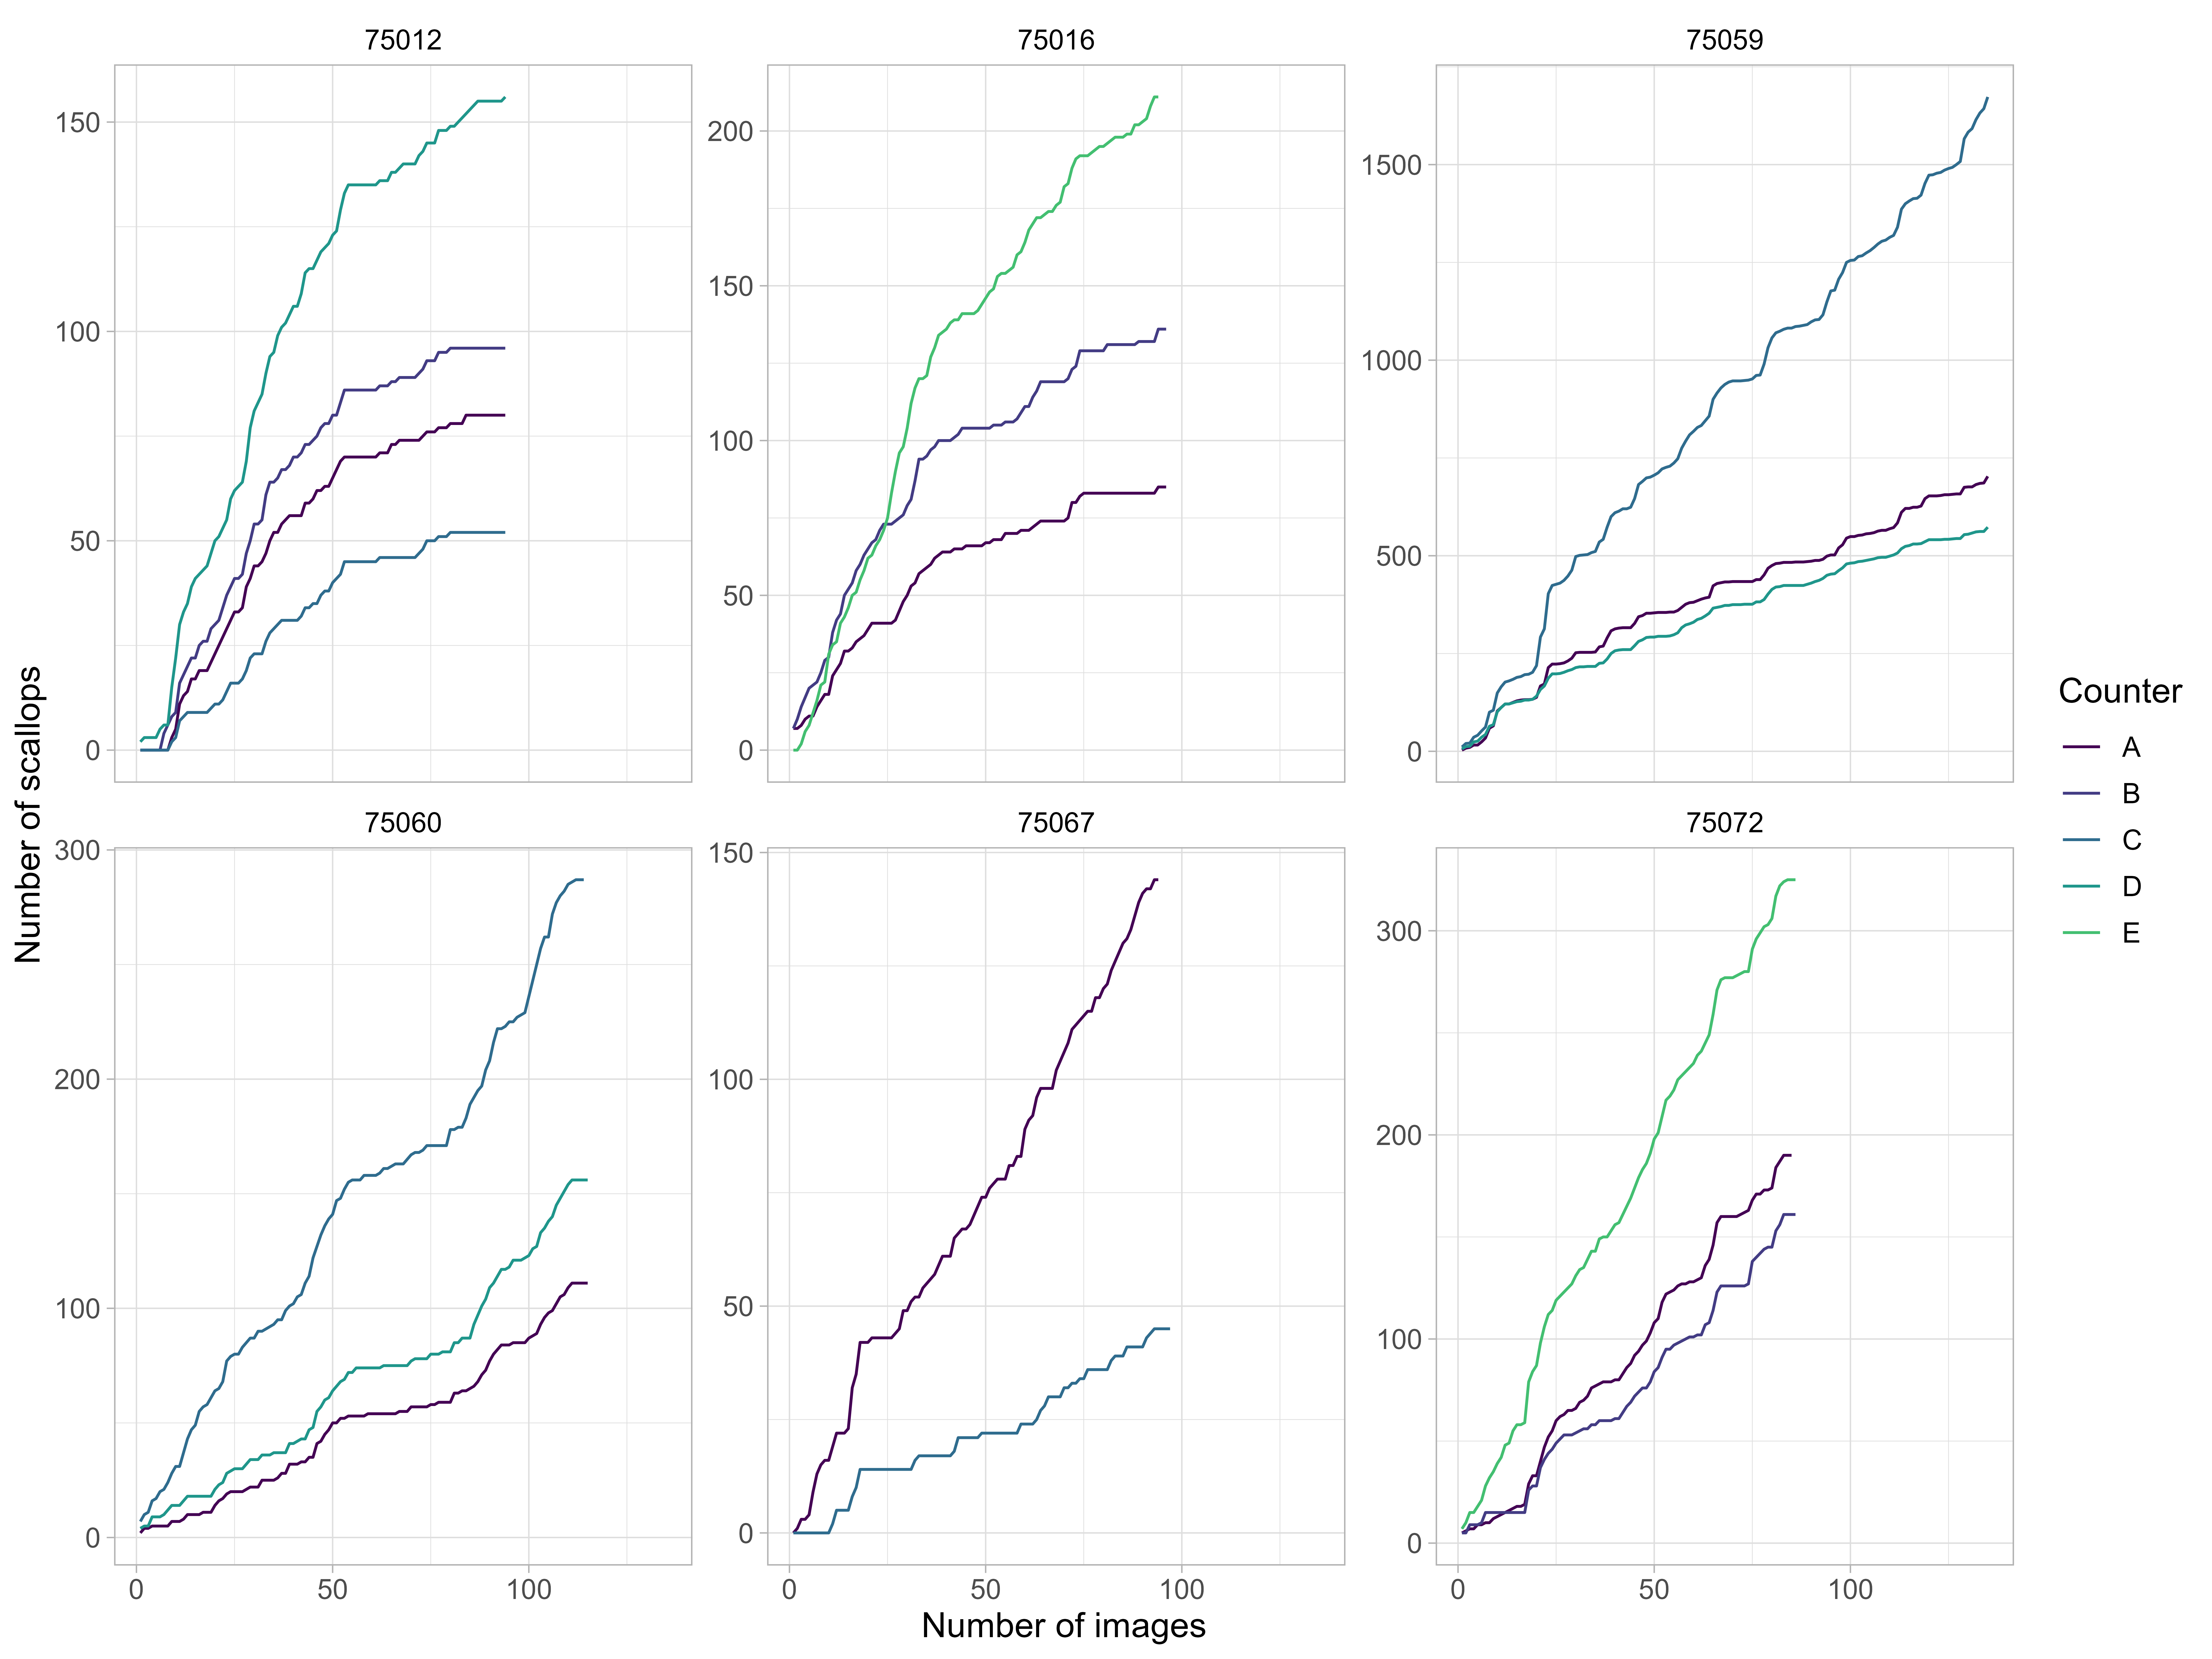
Figure 10: Scallop counts by counter for selected stations. Counts are cumulative number of scallops annotated with cumulative number of images per station. Stations were selected based on 1. more than 70 images, 2. high density (>0.8 scallops per image), and 3. relevant CV among counters (>0.2).