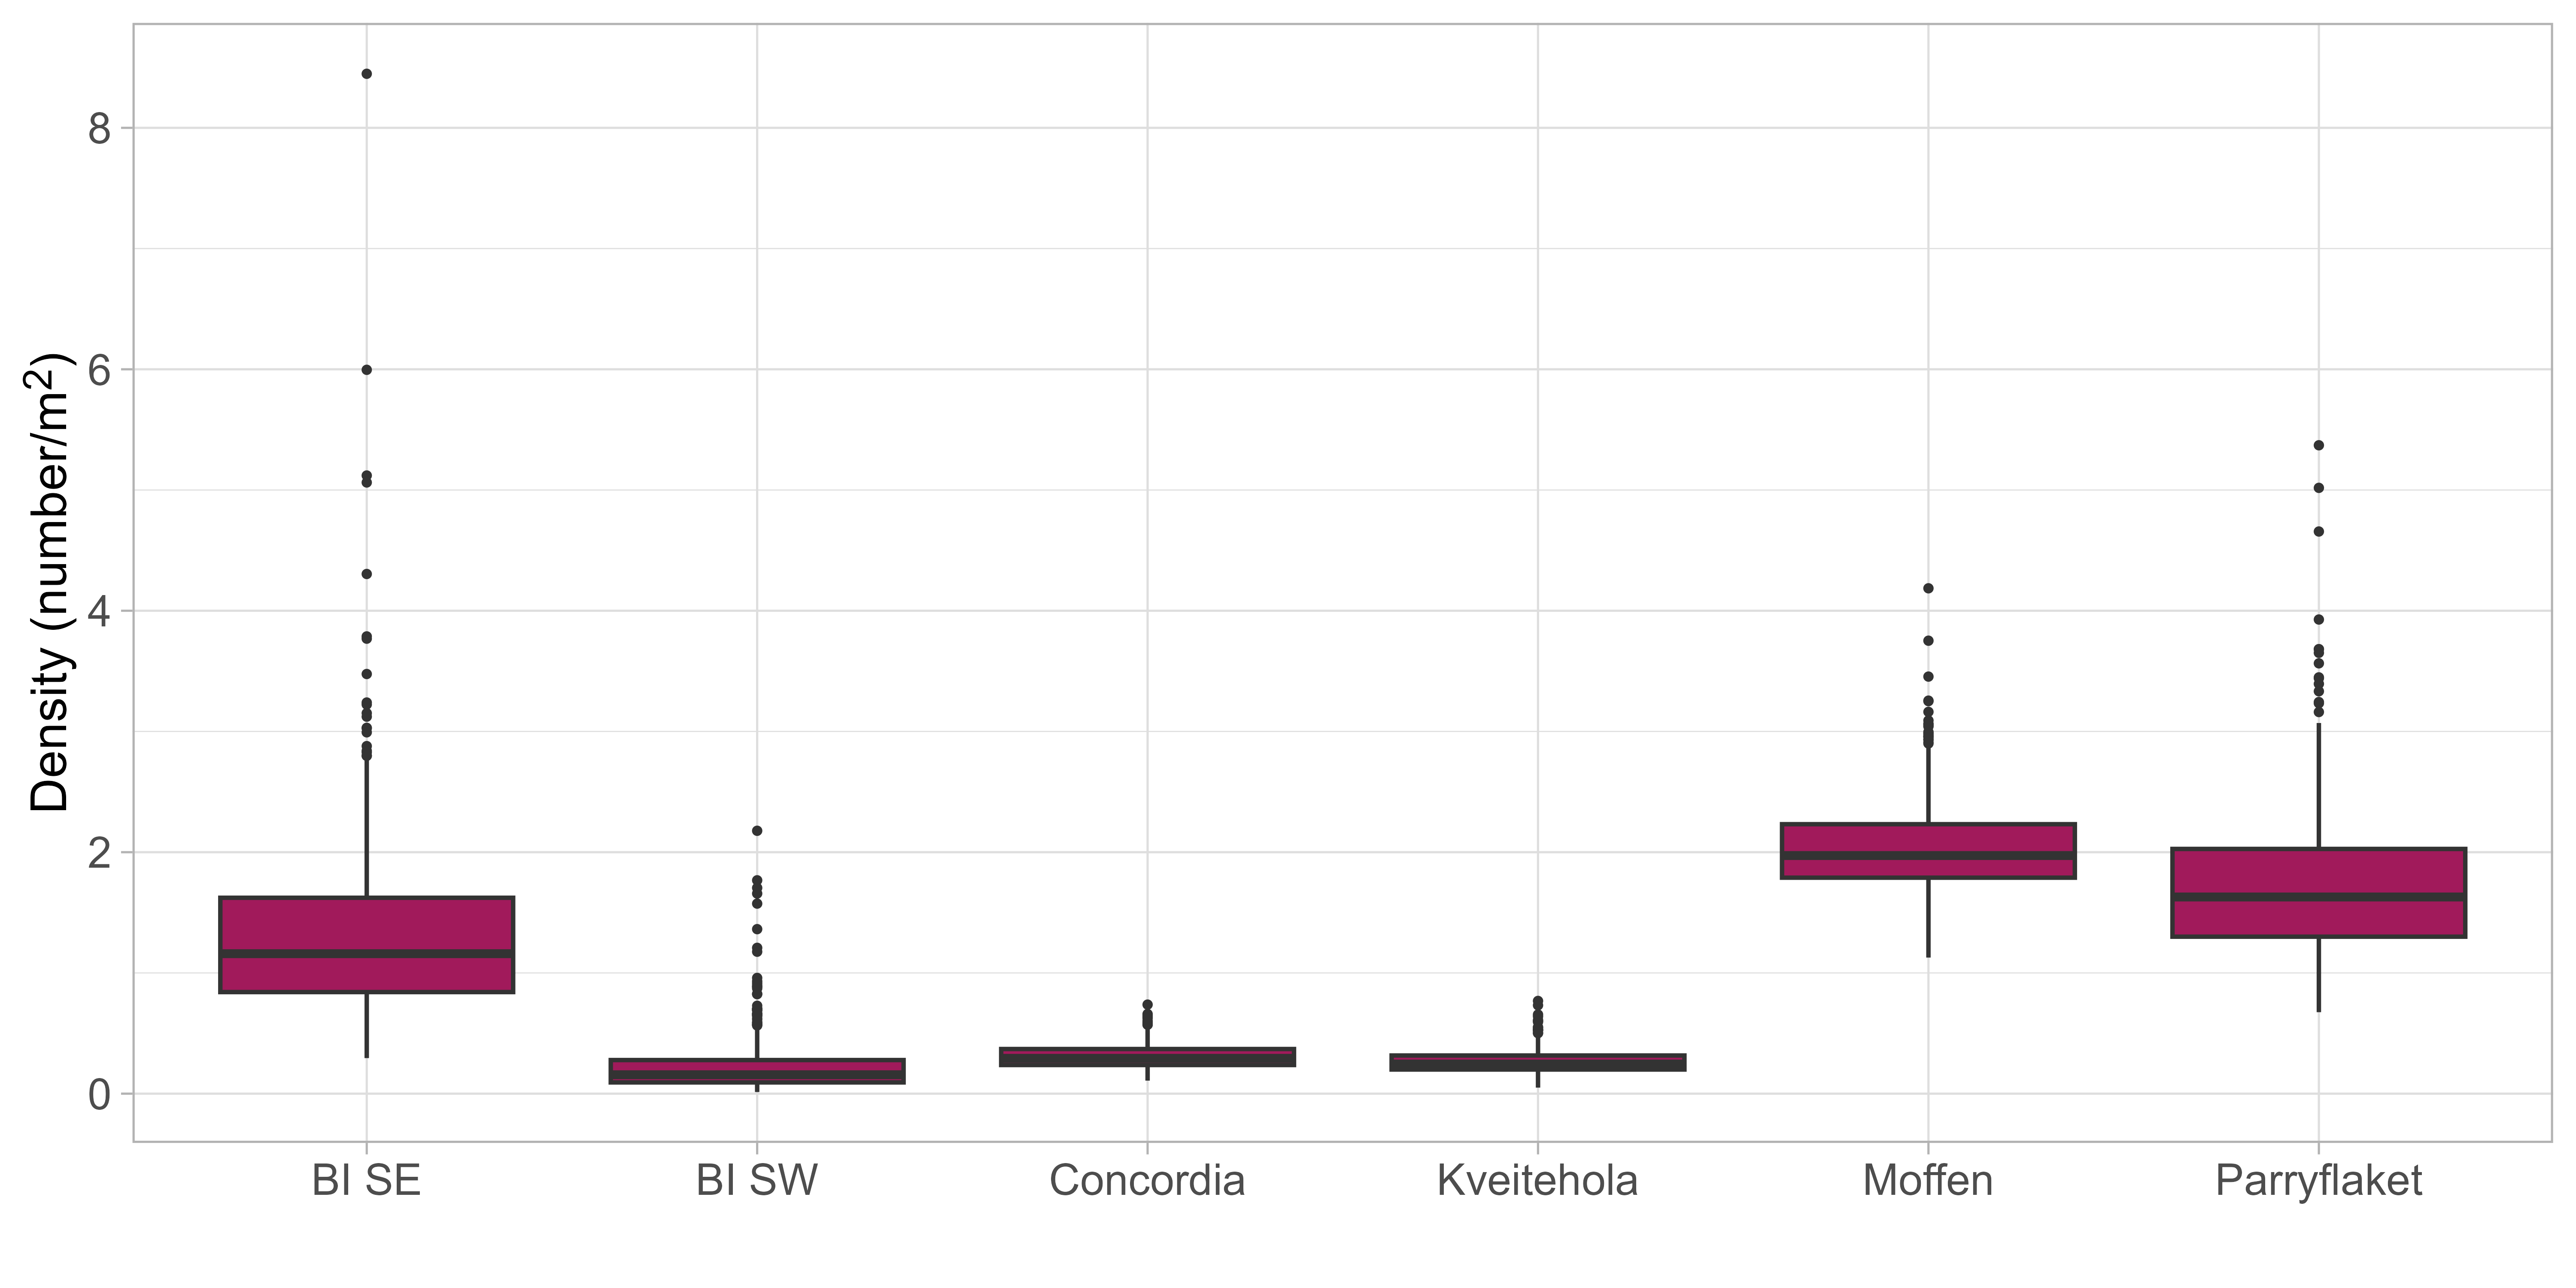
Figure 23: Estimated scallop density on scallop beds in Bear Island area and north of Svalbard (outside of protected areas). Shown are boxplots of estimated mean density based on 1000 iterations based on GAMM of video and dredge densities weighted with the number of images per station (dredge fixed to 0.5). Boxplots show median (solid lines), 25% and 75% percentiles (boxes), 1.5 interquartile range (whiskers), and outliers (dots). BI SE and SW are beds southeast and southwest of Bear Island, respectively.