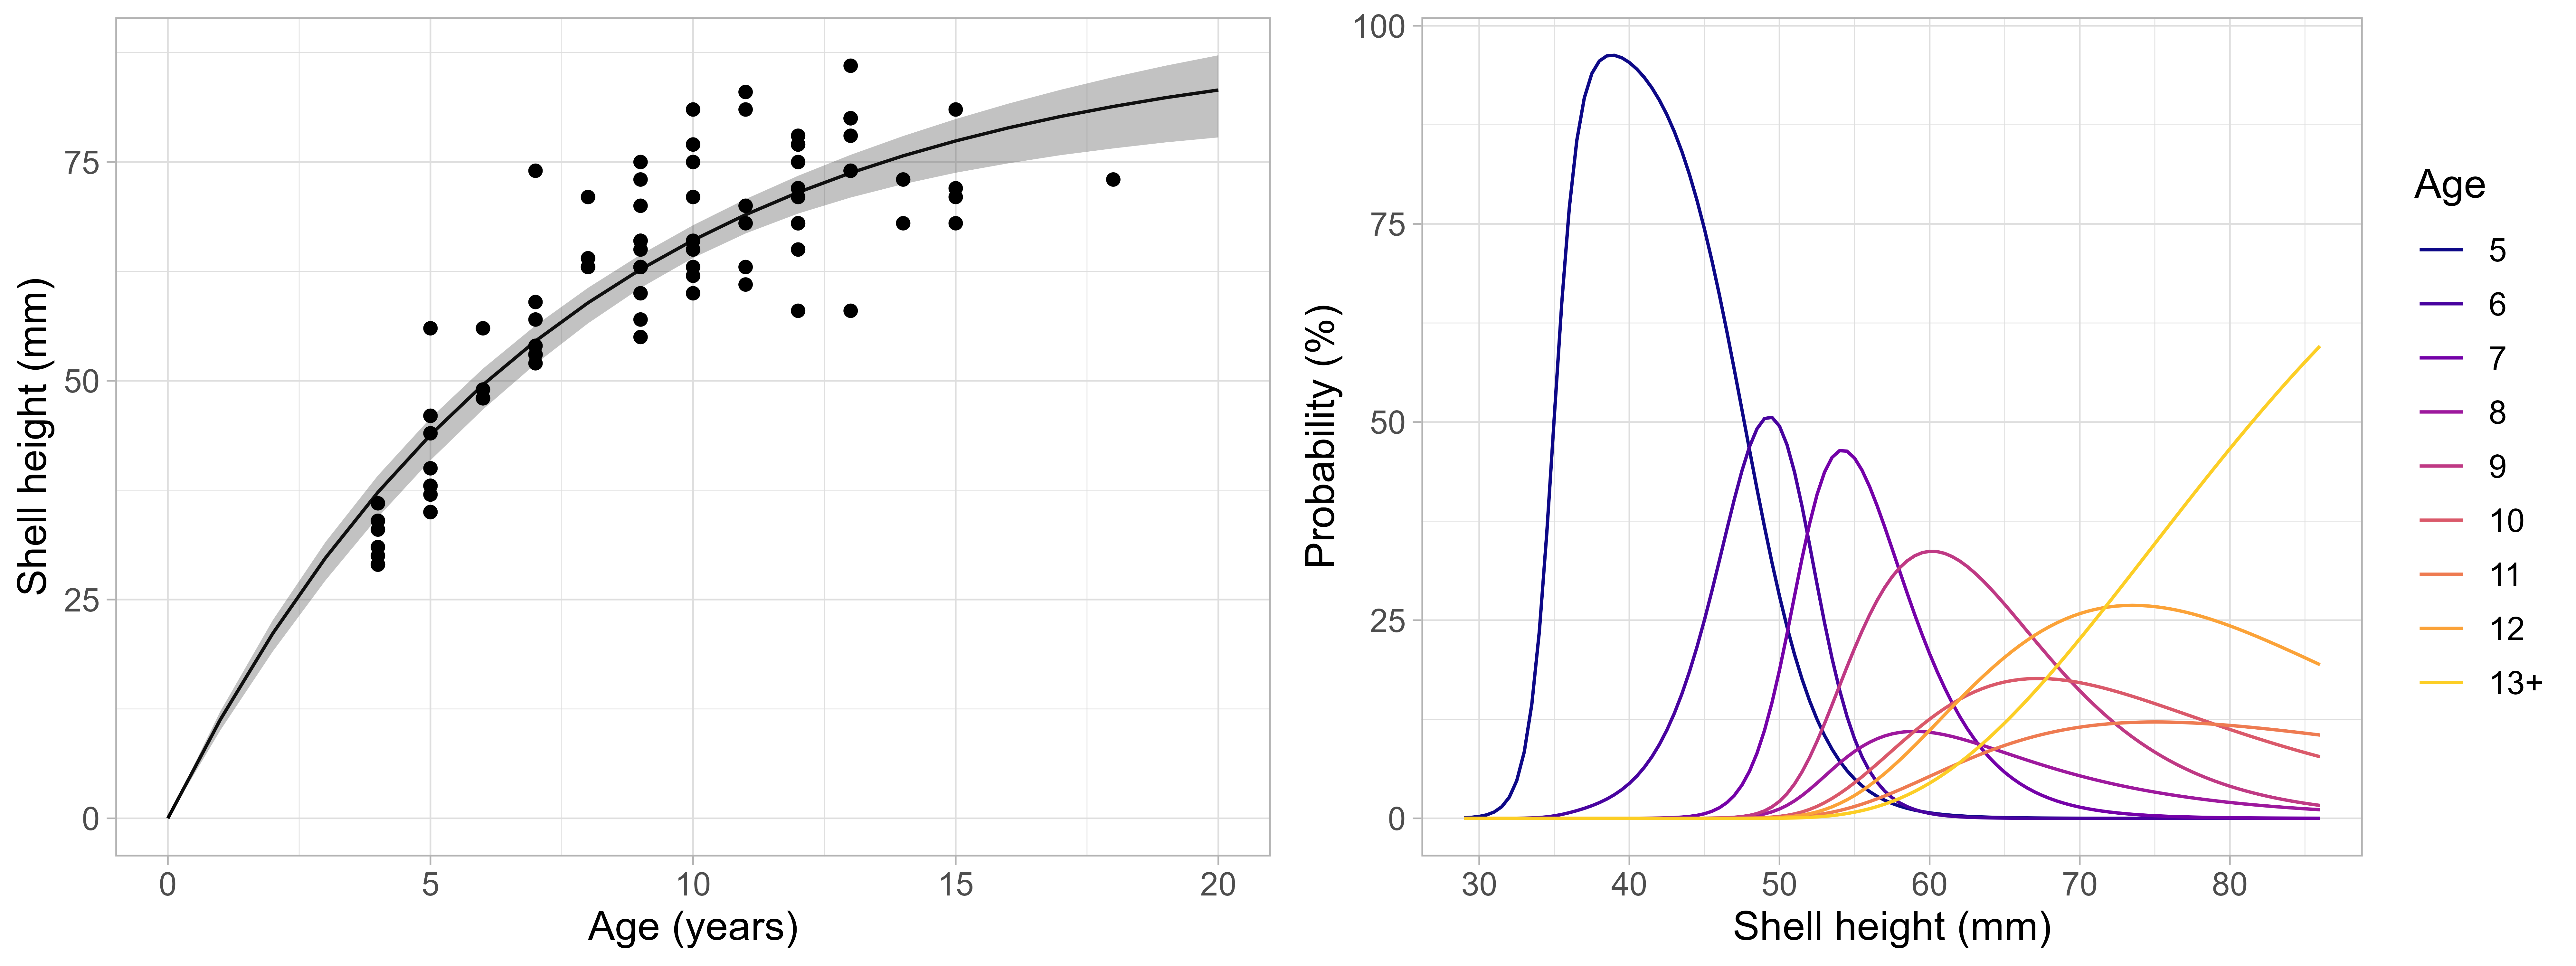
Figure 15: Age-length relationship for scallops observed on Moffen and Parryflaket beds. Left figure shows shell height at age and estimated Von Bertalanffy growth curve (line = mean, shaded area = 95% confidence intervals), and estimated probability of being at a specific age for a given shell height.