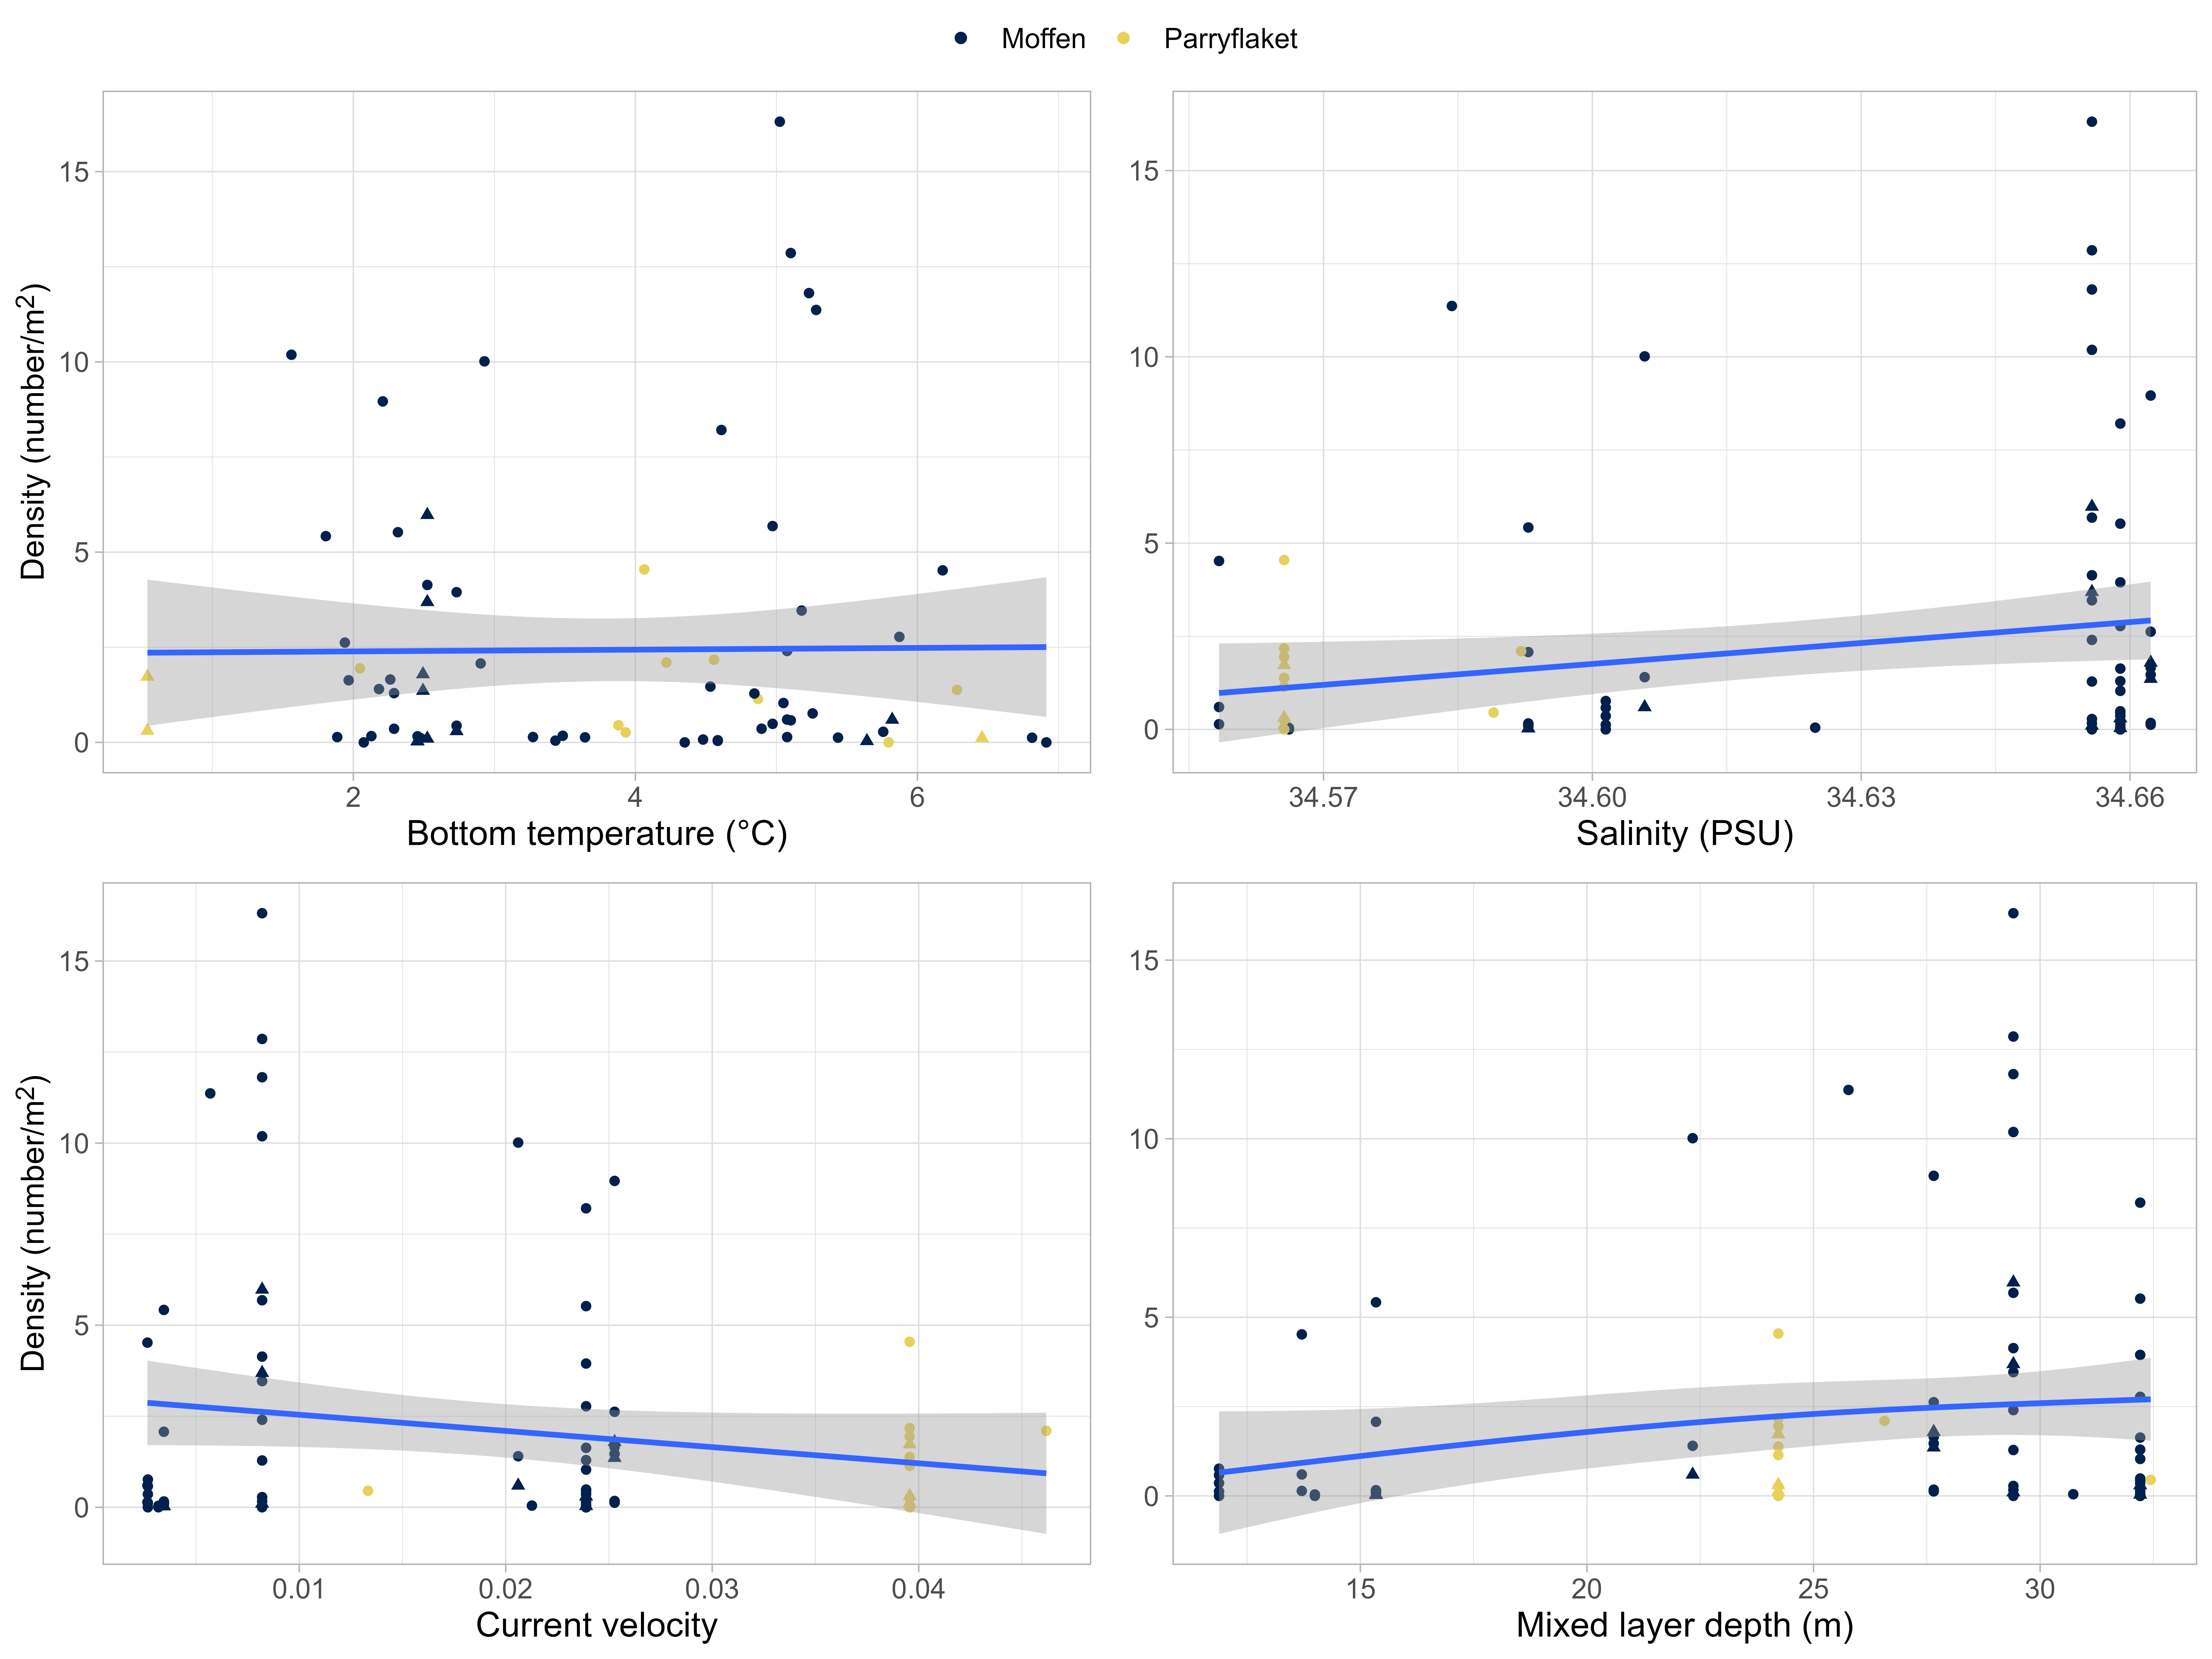
Figure 9: Relationship between scallop densities and bottom temperature, salinity, current velocity and mixed layer depth. Each dot represents an observed dredge (triangle) or video (circle) density from Moffen and Parryflaket beds (color). Bottom temperature are median temperature registered during the video transect or for dredge stations modelled bottom temperature (monthly means from the TOPAZ4 Arctic Ocean system model for the closest location). Salinity, current velocity and mixed layer depth are modelled monthly means for the survey period. Lines represent trendlines based on GAM smoother and shaded areas 95% confidence intervals.