Gå til hovedinnhold
Havforskningsinstituttet
HI
English
<- Tilbake
Søk
Søk
Søk
View page in English
Figur
Fra rapporten:
Survey of Iceland scallop beds north of Svalbard
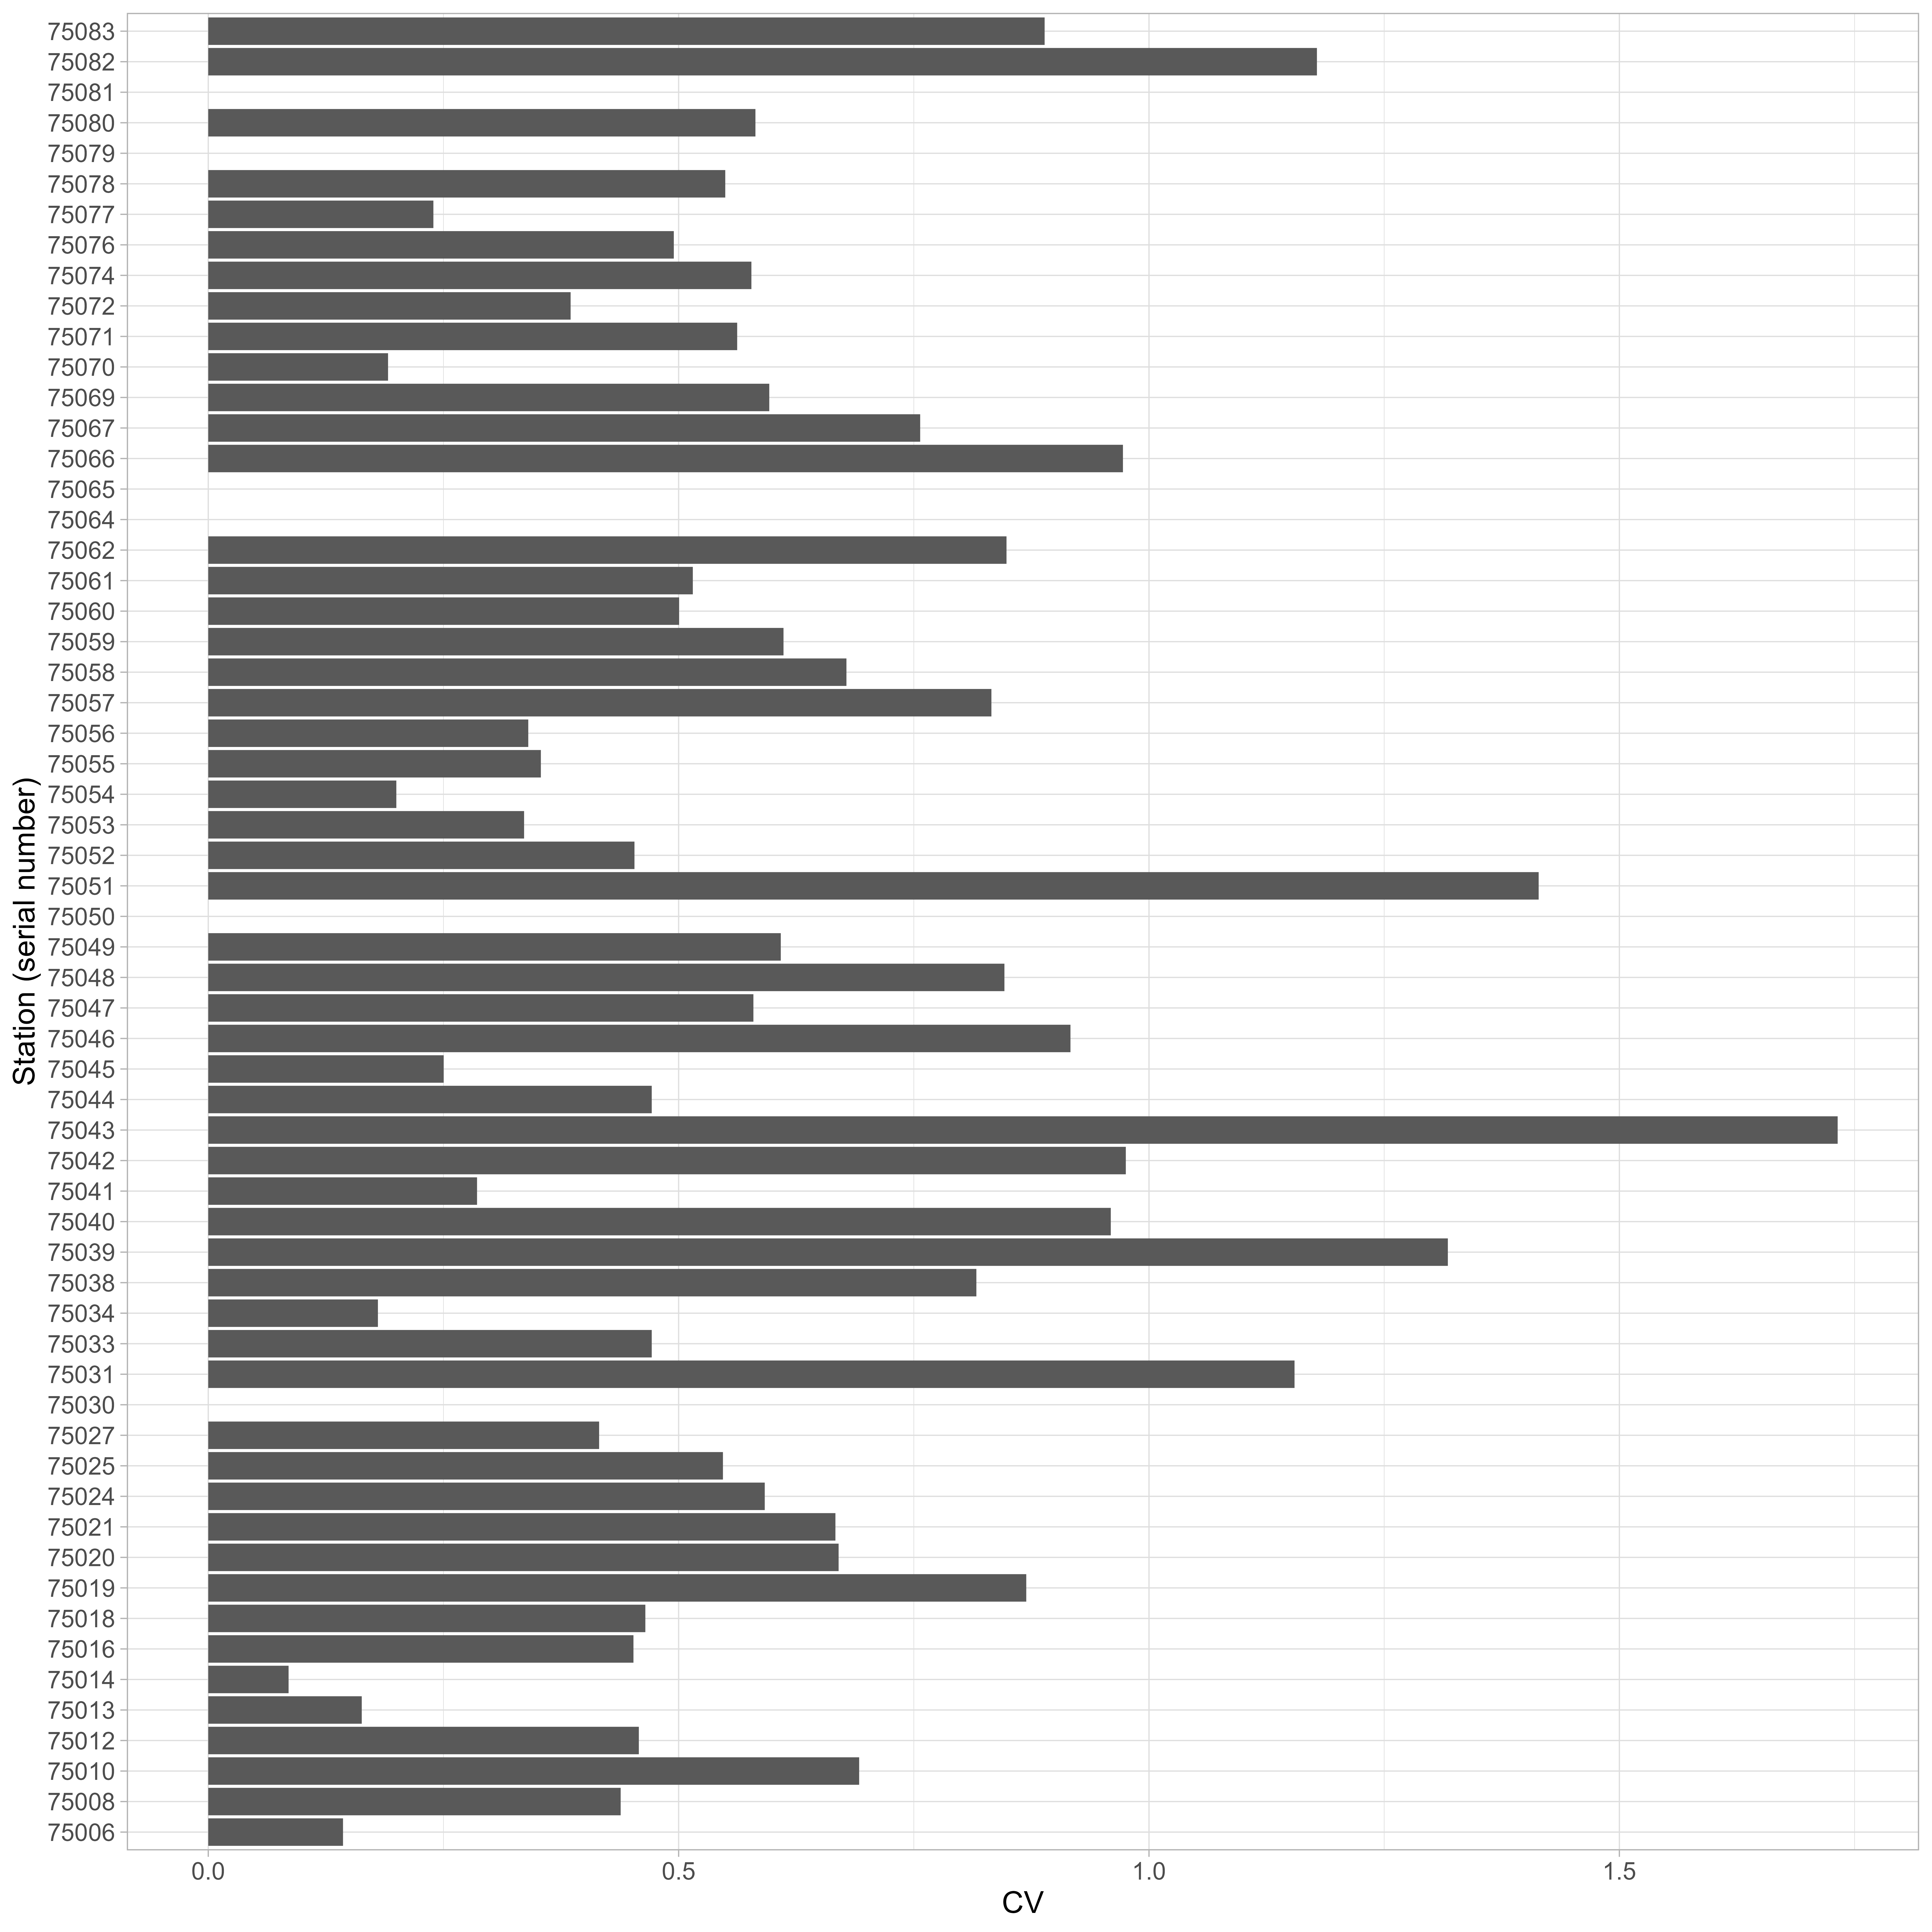
Figure 11: Coefficient of variation (CV) among counts of scallop densities per station. CVs were calculated as the standard deviation among mean number of scallops per counter and station, divided by the global mean per station.