Gå til hovedinnhold
Havforskningsinstituttet
HI
English
<- Tilbake
Søk
Søk
Søk
View page in English
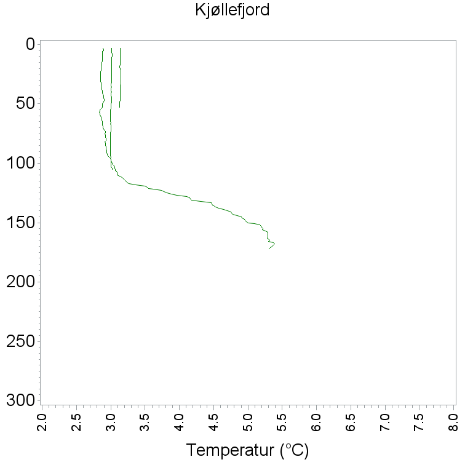
Figur
Fra rapporten:
Skreitokt nord
Figur 11 Temperaturprofiler for alle CTD stasjonene.