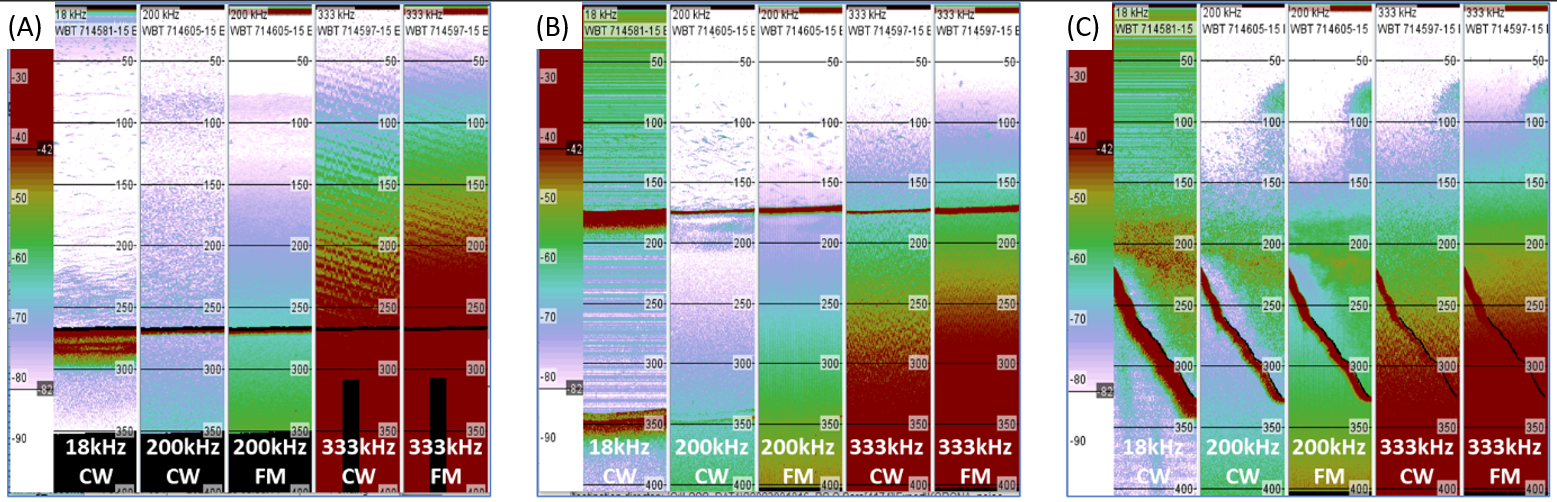
Figure 3 . Examples of unfiltered calibrated EK80 data from an earlier survey (A) compared to this survey (B, C) with RV «G. O. Sars», for surveys 2022115 (A) and 2023001016 (B, C), respectively. The colour-scales are similar between the examples (left column in figures). The five columns in each of subpanel, are the 18 kHz CW, 200 kHz CW, 200 kHz FM, 333 kHz CW, 333 kHz FM, respectively. Between surveys 2022115 (A) and 2023001016 (B, C) the 18 kHz transducer was changed from a narrowband transducer to a wideband transducer, while the 333 kHz transducer was modified with a different grounding (sea-water grounding). The noise in the 18 kHz was much less prominent in the 2022115 survey compared to the this survey, while the noise at 333 kHz was much improved after the modifications.