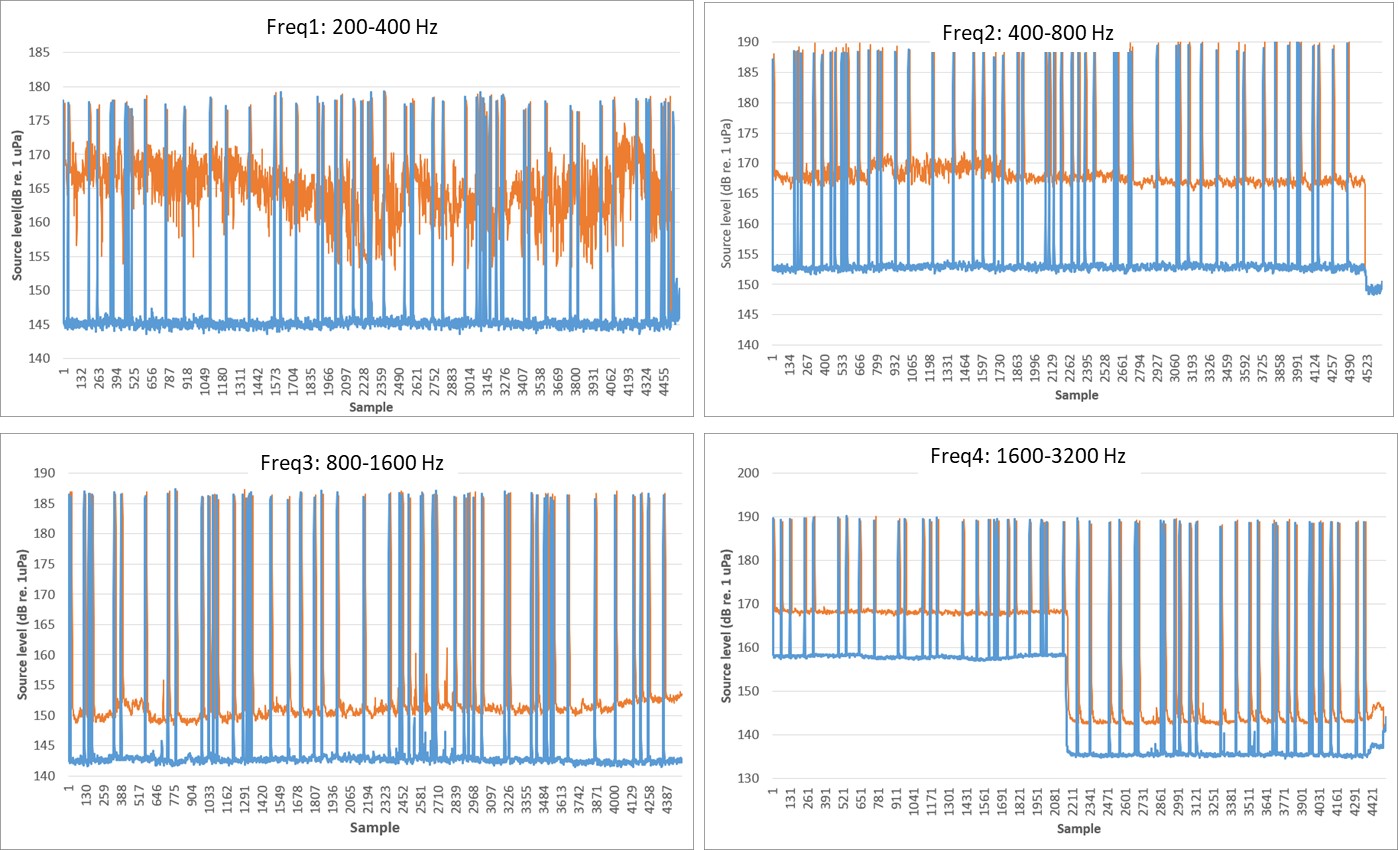
Figure 26 . Approximate source level for the 4 frequency bands. The blue curve is based on the measurements of the hydrophone 10 m below the source, the orange curve on the hydrophone at 100 m depth. In particular the hydrophone at 100 m depth show quite a lot of noise due to hydraulics and/or echosounder. This is particularly apparent for Freq 4 , where the hydraulics were turned off approximately midway into the measurement.