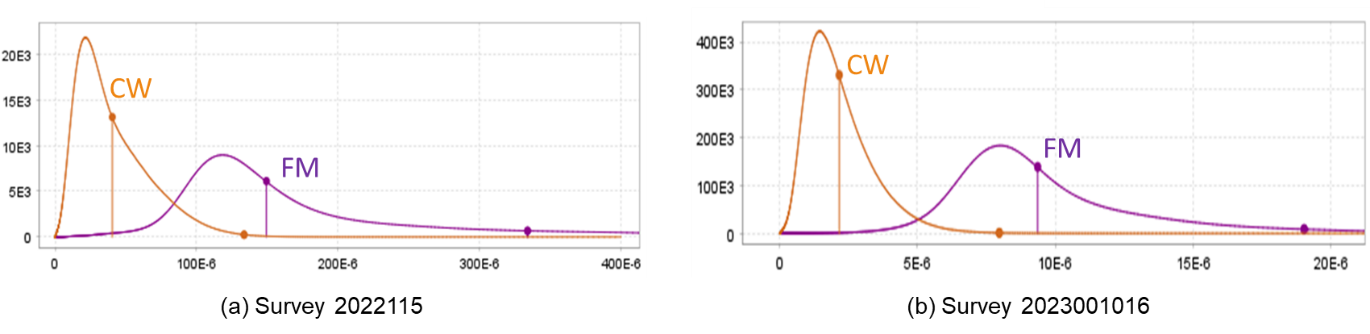
Figure 4 . CW and FM noise estimates, respectively, from the original installation (a), and the modified installation (b). The curves are the probability-density-function for the noise, where the x-axis represents the strength of the noise. Thus, noise at 333-kHz were almost 20 times stronger in the 2022115 survey compared to the 2023001016 survey.