Gå til hovedinnhold
Havforskningsinstituttet
HI
English
<- Tilbake
Søk
Søk
Søk
View page in English
Figur
Fra rapporten:
Survey report for CRIMAC SFI 2023
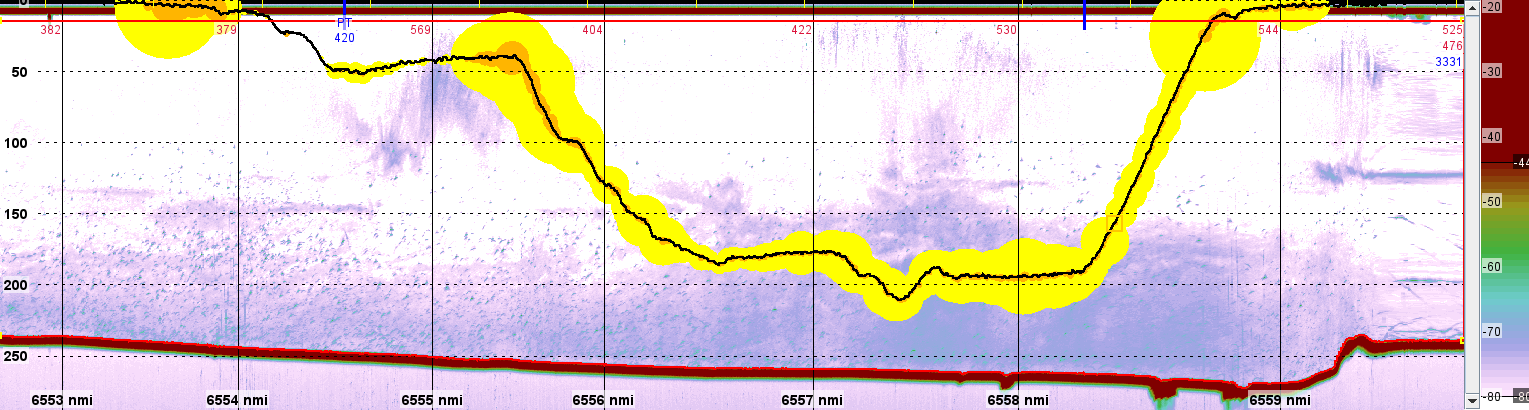
Figure 18 . Echograms and Deep Vision depth tracks during trawling. The colours along the trawl path indicate species and bubble size quantities estimated by the algorithm. Images are created in LSSS. Colour explanations can be found in Table 7 .