Gå til hovedinnhold
Havforskningsinstituttet
HI
English
<- Tilbake
Søk
Søk
Søk
View page in English
Figur
Fra rapporten:
Identifying priorities for the protection of deep-sea species and habitats in the Nordic Seas
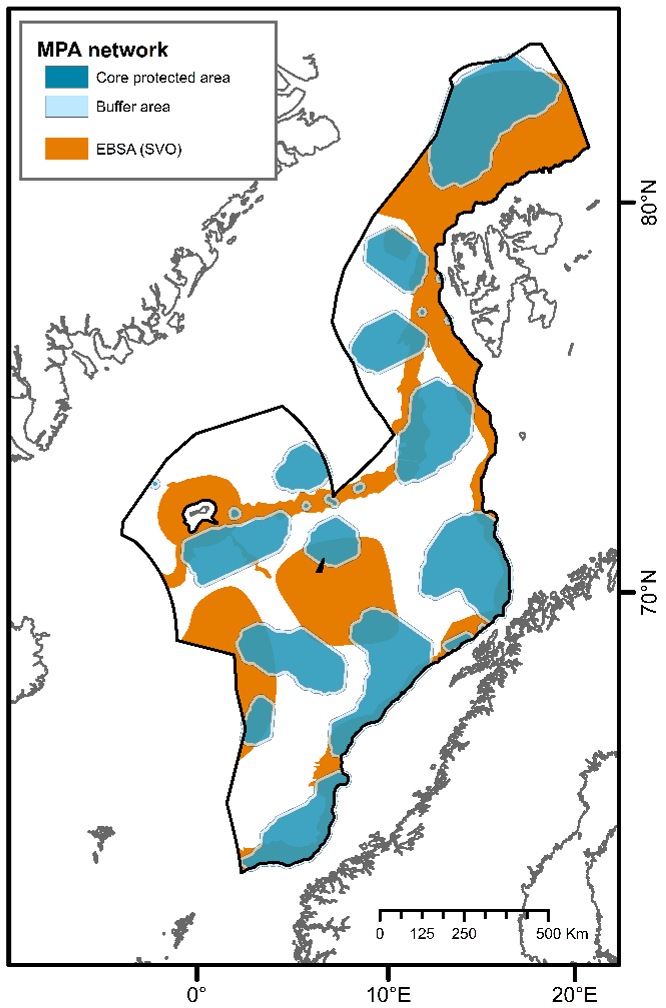
Figure 6. Presentation of the MPA network 30%C with 10 km buffers (in blue) and the EBSAs identified for benthic species and habitats in the study area (in orange).