Gå til hovedinnhold
Havforskningsinstituttet
HI
English
<- Tilbake
Søk
Søk
Søk
View page in English
Figur
Fra rapporten:
Identifying priorities for the protection of deep-sea species and habitats in the Nordic Seas
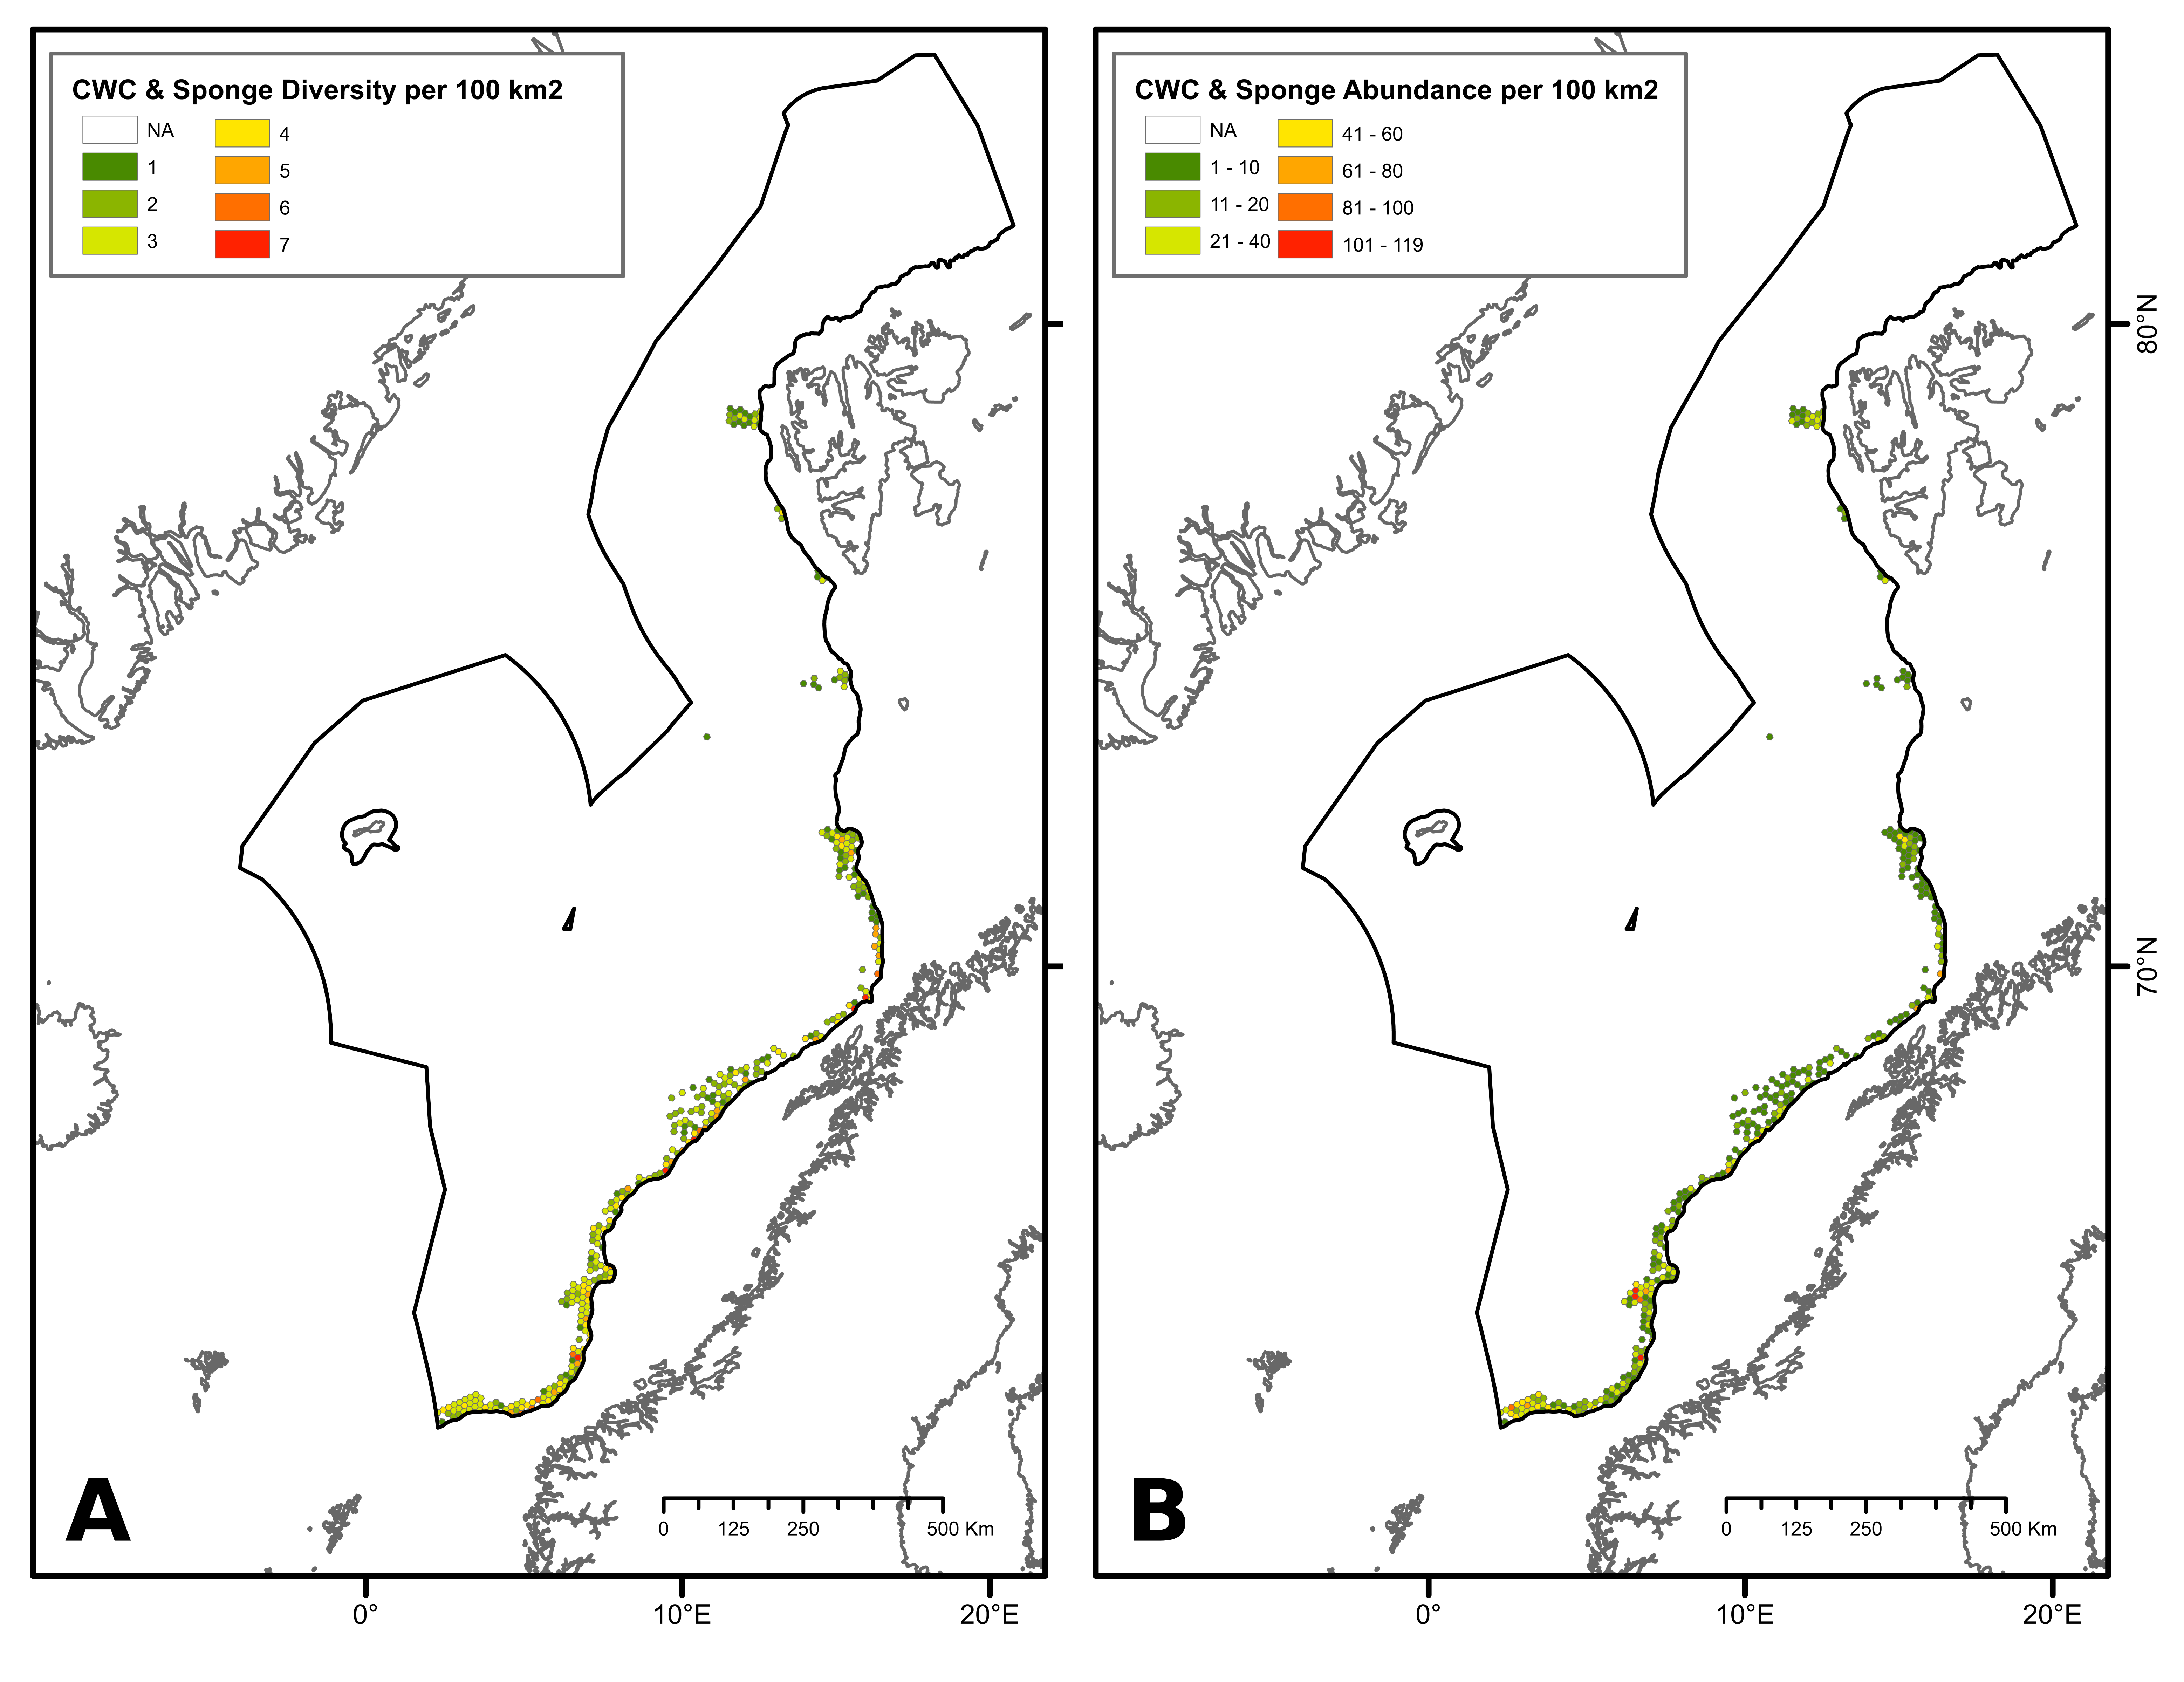
Figure 2. Maps showing A (left): the diversity of CWC (cold-water corals) and sponge habitat type observation per 100 km²; and B (right): the abundance of CWC and sponge aggregation observation per 100 km² in the study area.