Gå til hovedinnhold
Havforskningsinstituttet
HI
English
<- Tilbake
Søk
Søk
Søk
View page in English
Figur
Fra rapporten:
Numerical models and long term monitoring
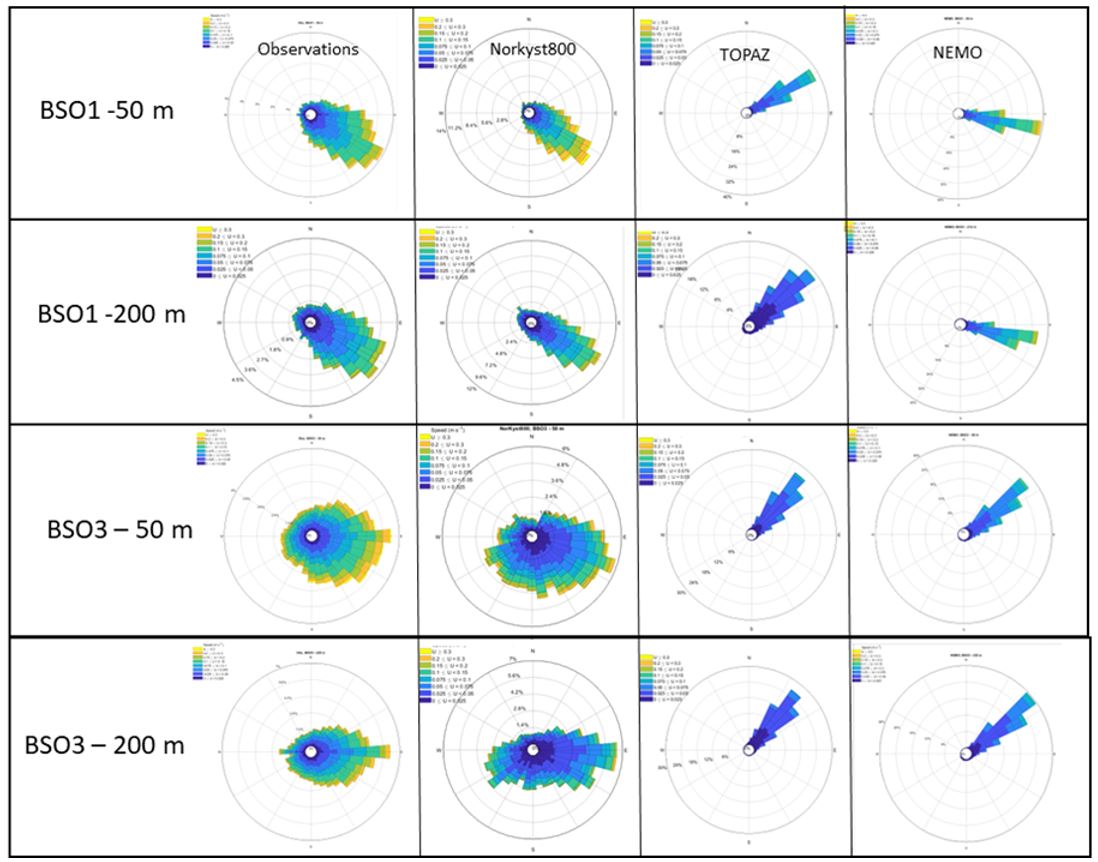
Figure 14: Current roses comparing observed and simulated (Norkyst, NEMO-NAA10 km and TOPAZ) simulated velocity at 50 m and 200 m depth and at moorings BSO1 and BSO3 located in the Barents Sea Opening.