Gå til hovedinnhold
Havforskningsinstituttet
HI
English
<- Tilbake
Søk
Søk
Søk
View page in English
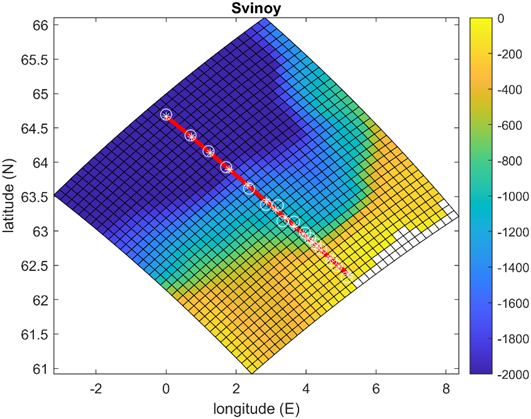
Figur
Fra rapporten:
Numerical models and long term monitoring
Figure A11: Svinøy transect (red) with CTD sampling stations indicated by asterisks and the closest TOPAZ model grid points to each station indicated by open circles. Contours show TOPAZ bottom topography (m).