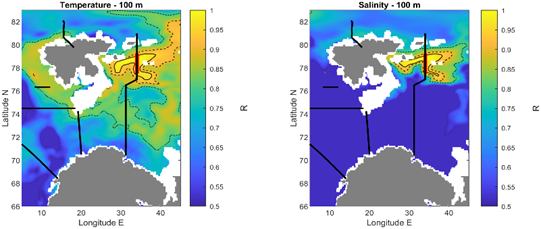
Figure 25. Maps of correlation coefficients between annual mean temperature at 100 m depth in the northern part of the Vardø-Nord transect (as indicated in red) and all surrounding model grid points. Dashed lines indicated the 0.95, 0.9 and 0.85 correlation (R) contours. Black lines indicate the locations of fixed CTD transects. Plots are generated using TOPAZ Arctic Ocean Physics Reanalysis.