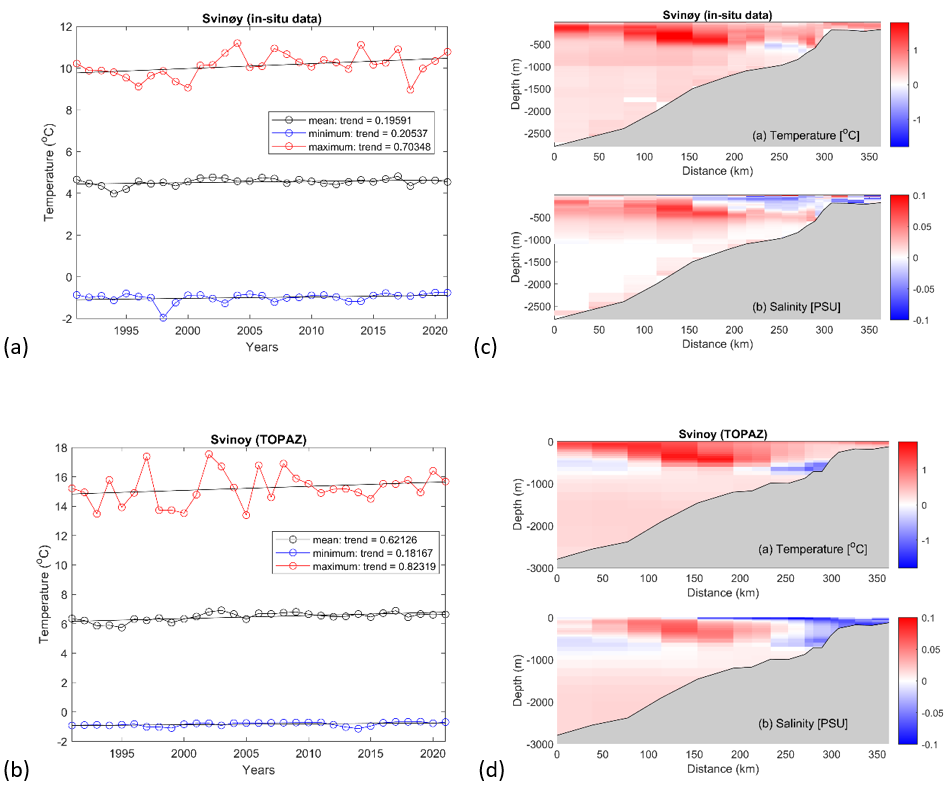
Figure 6: Mean, minimum and maximum yearly temperatures recorded along the Svinøy transect calculated from (a) in-situ data, and (b) TOPAZ, with linear trends overlain in black. In (c) contour plots showing linear trends in temperature and salinity at each individual station and depth calculated from in-situ data and (d) from TOPAZ, over the period 1991-2021.