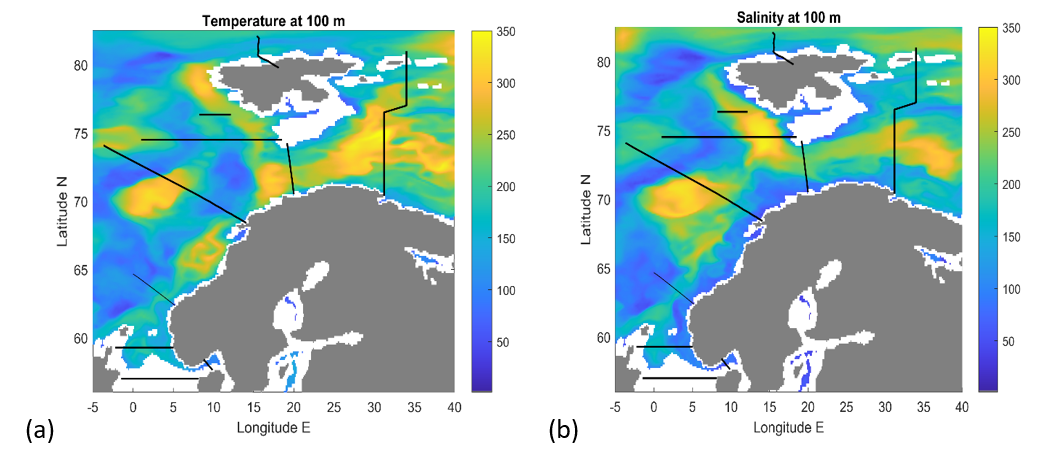
Figure 23: Correlation maps of annual mean (1991-2021) TOPAZ (a) temperature and (b) salinity at 100 m depth, showing the size of the area around each grip point, at which the time series are correlated with an R value of more than 0.95. Units are km2.