Gå til hovedinnhold
Havforskningsinstituttet
HI
English
<- Tilbake
Søk
Søk
Søk
View page in English
Figur
Fra rapporten:
Numerical models and long term monitoring
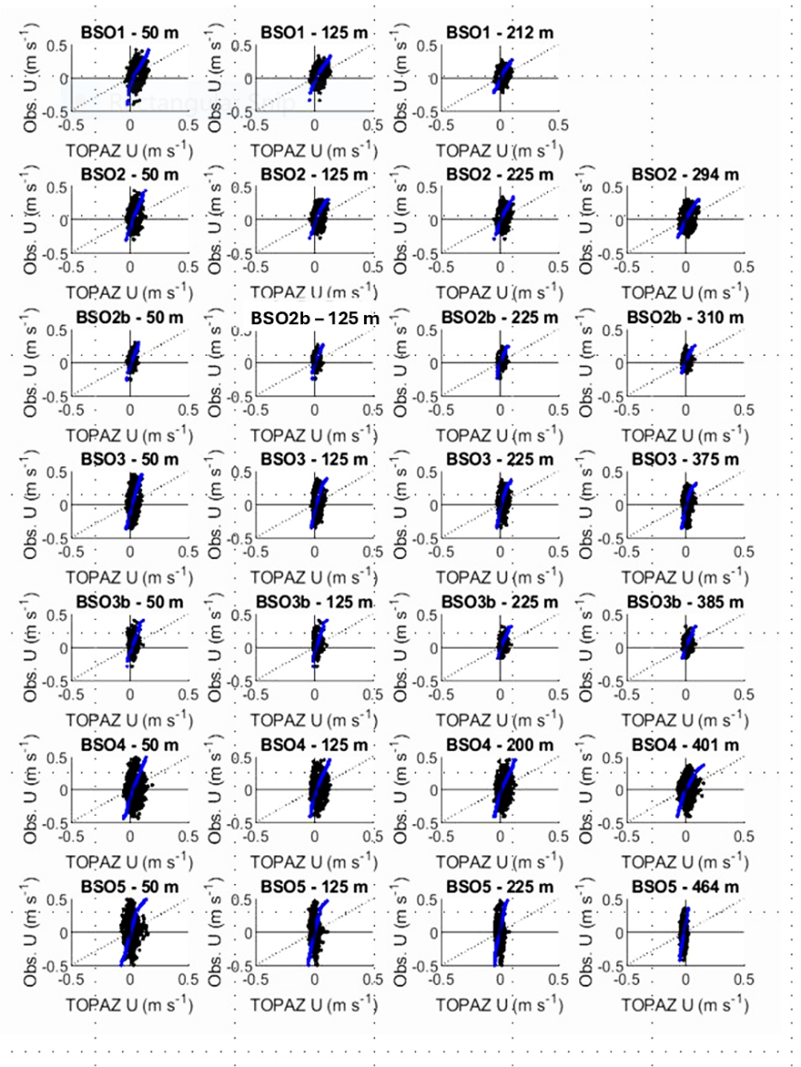
Figure 13: Scatter plots (black) overlain by quantile-quantile plots (blue) comparing eastward velocity from TOPAZ and from observations at several locations and depths situated across the Barents Sea opening.