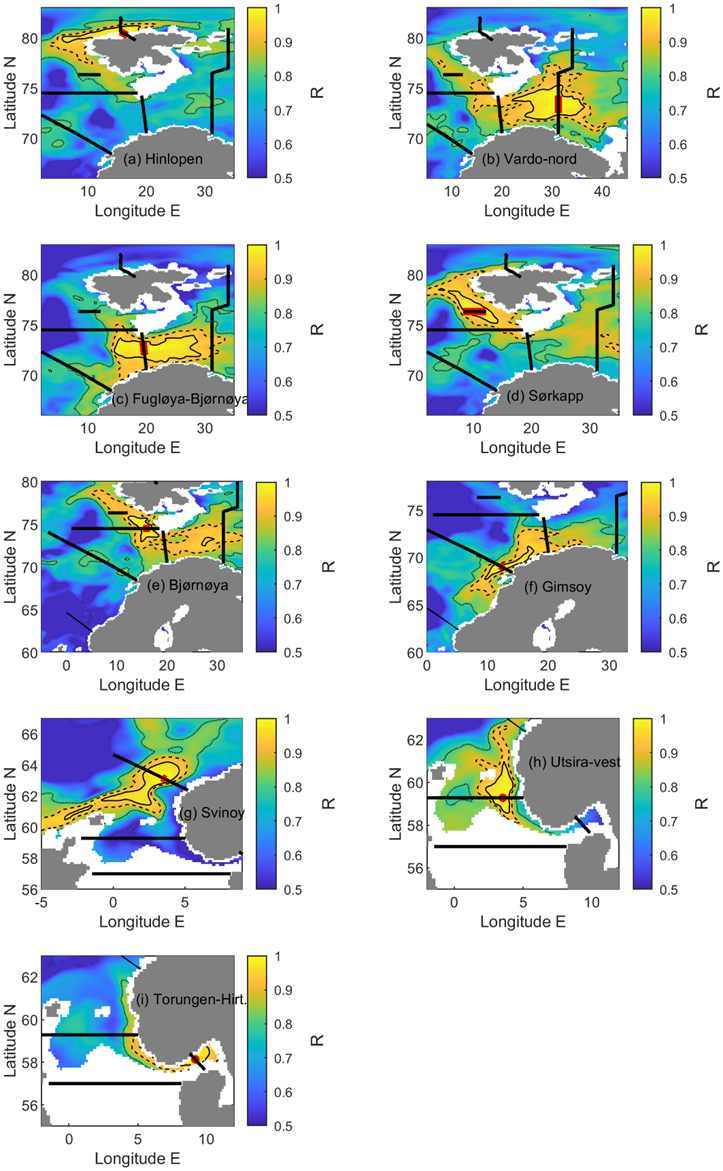
Figure 21: Maps of correlation coefficients between yearly mean 100 m depth temperature time series at station(s) indicated by a red dot or line along each IMR transect and all surrounding model grid points. Dashed lines indicated the 0.95, 0.9 and 0.85 correlation (R) contours. Black lines indicate the locations of fixed CTD transects. Plots are generated using the TOPAZ Arctic Ocean Physics Reanalysis.