Gå til hovedinnhold
Havforskningsinstituttet
HI
English
<- Tilbake
Søk
Søk
Søk
View page in English
Figur
Fra rapporten:
Numerical models and long term monitoring
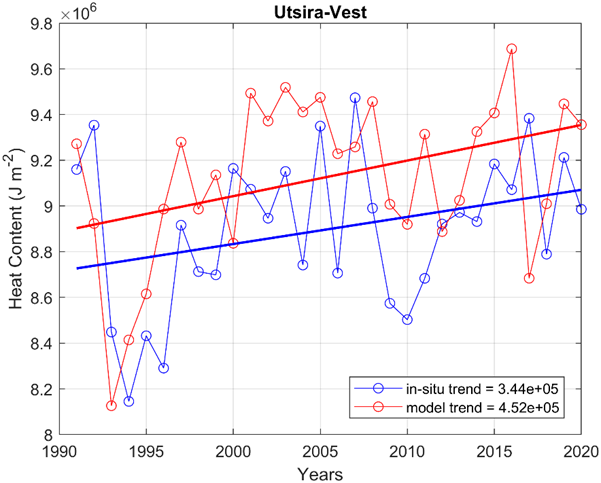
Figure 10: Yearly mean heat content calculated from in-situ (blue) and model (red) data at 59.28 N, 3.63 E along the Utsira-West transect, with linear trends overlain in black.