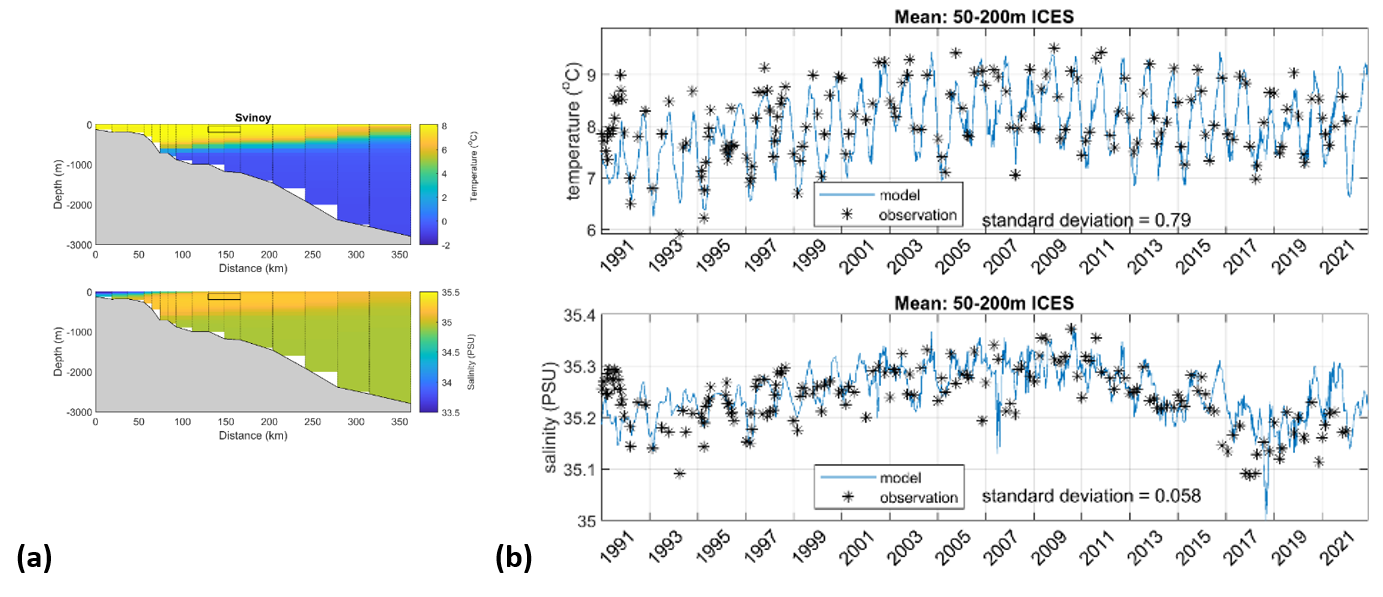
Figure 3: (a) Mean TOPAZ temperature (top) and salinity (bottom) conditions along the Svinøy transect averaged over the period 1991-2021. Black vertical lines indicate CTD sampling stations, and the black box shows the area over which data are averaged for ICES (b) Temperature (top) and salinity (bottom) time series averaged over the region indicated, calculated from in-situ measurements (black asterisks) and TOPAZ (blue line).