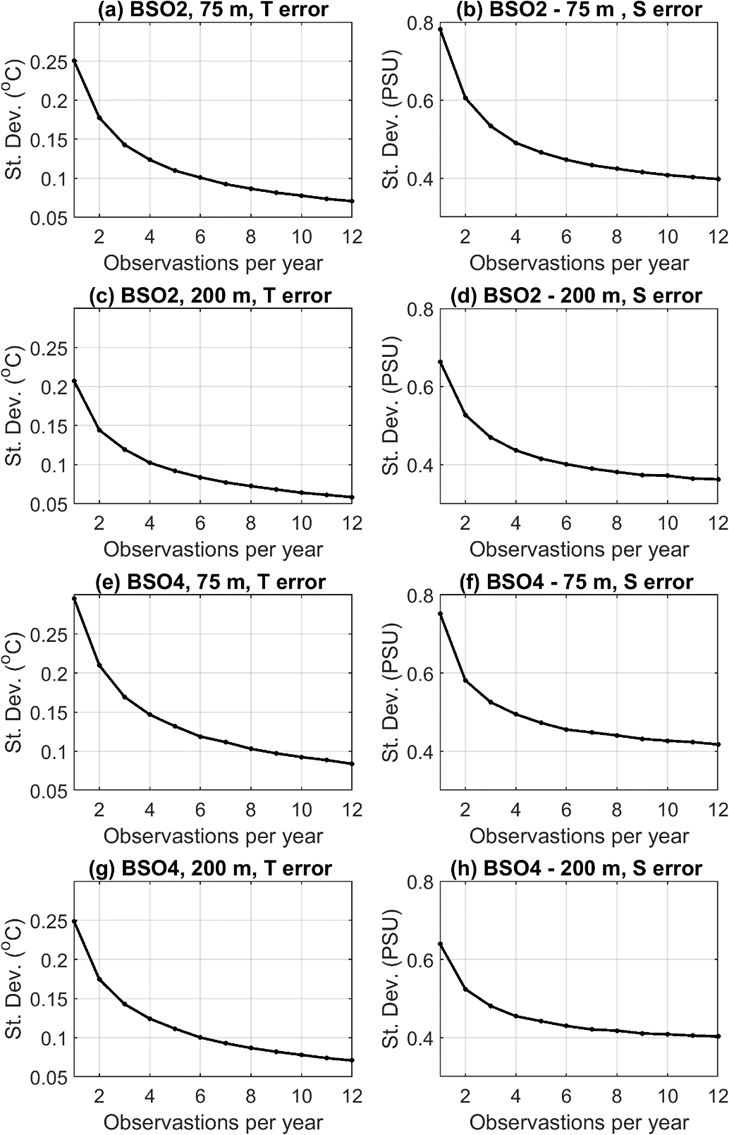
Figure 17: Standard deviation in the error of estimated annual mean temperature and salinity, shown as a function of sampling interval per year. Standard deviations represent the mean of 1000 calculations generated using randomly selected days of the year. Data are presented at 75 m and 200 m depth at two stations in the vicinity of the Barents Sea opening as indicated.