Gå til hovedinnhold
Havforskningsinstituttet
HI
English
<- Tilbake
Søk
Søk
Søk
View page in English
Figur
Fra rapporten:
Survey report for testing a sparker sound source on cod behavior (SpawnSeis Sparker)
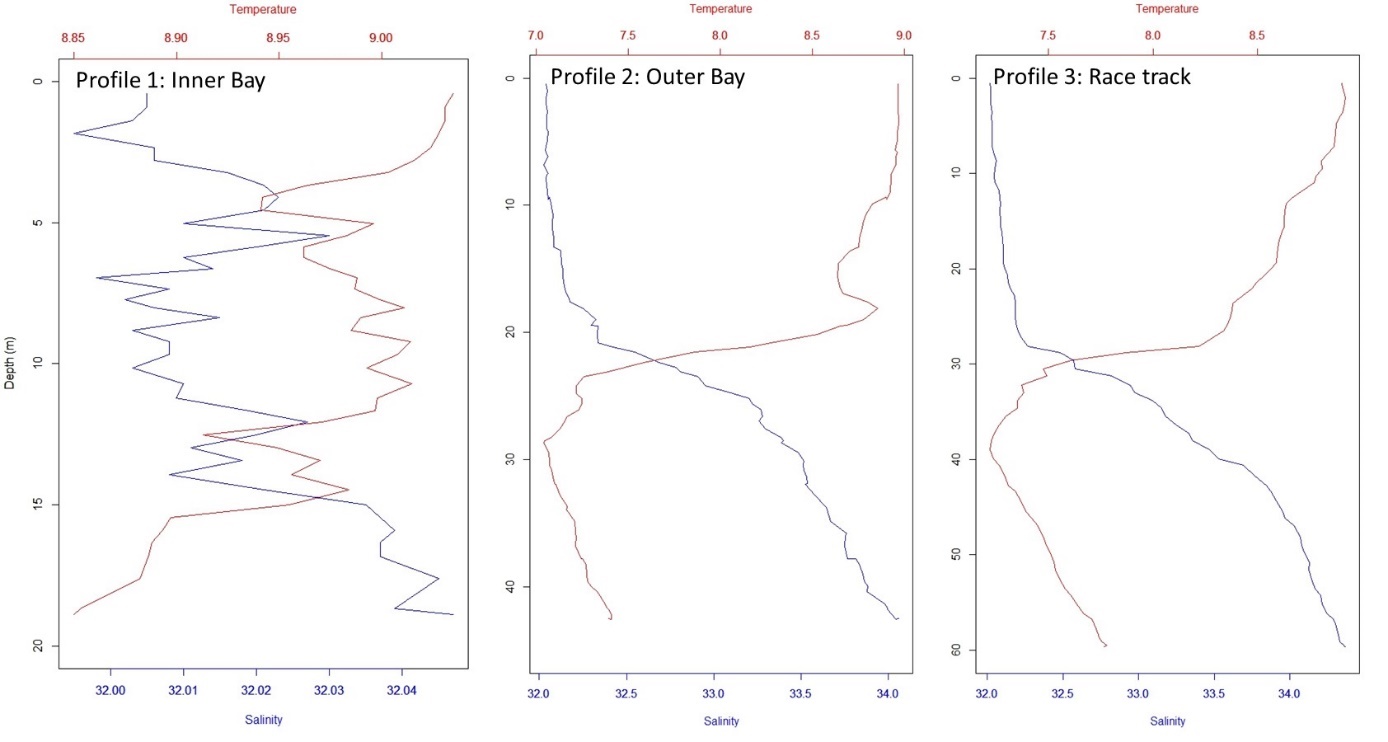
Figure 15. CTD profiles from the 3 casts showing salinity (blue curves) and temperature (red curves) as a function of depth.