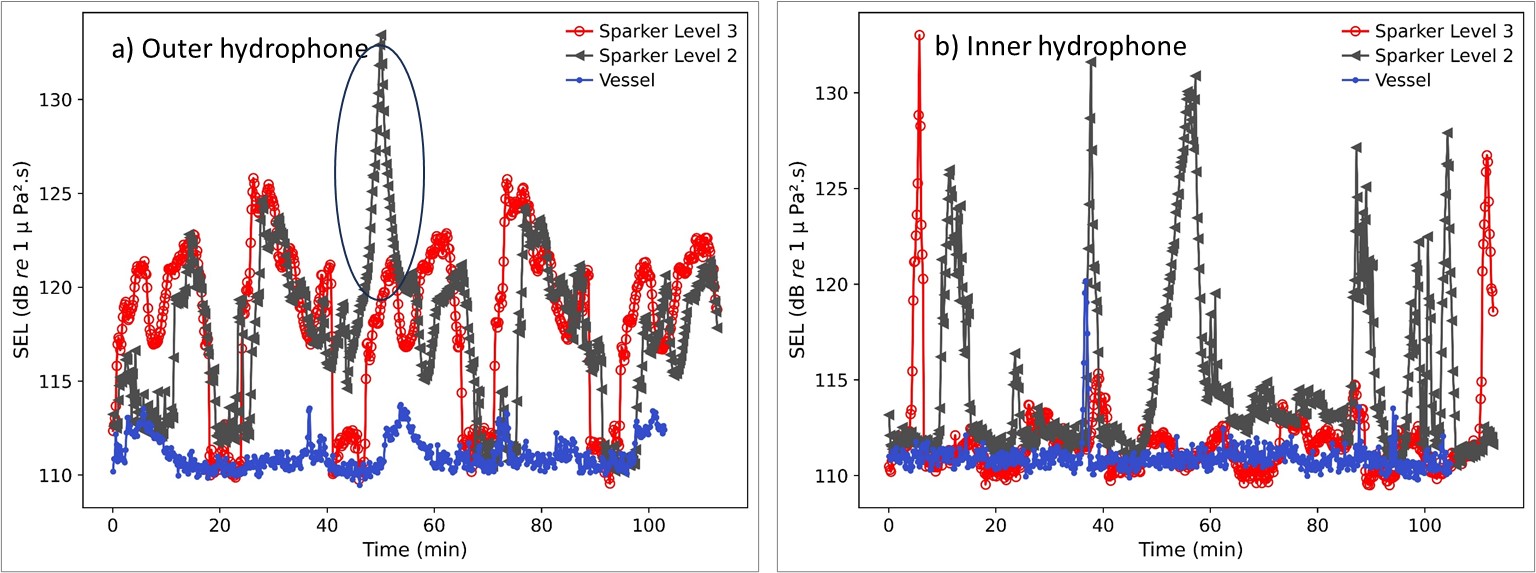
Figure 13. SEL over 10 sec from outer Sound trap hydrophone (a) and inner sound trap hydrophone (b) for the two sparker levels 2 and 3 and the vessel treatment. The data for the vessel and sparker treatments are from block 4, starting at 21:45:00 and 23:45:00, respectively, while sparker level 2 are from block 3, starting at 19:45:00. The high peaks for level 2 seen both in the outer (indicated by a circle), in in particular for the inner bay, are likely from recreational boats passing the hydrophone rather than from the sparker signal.