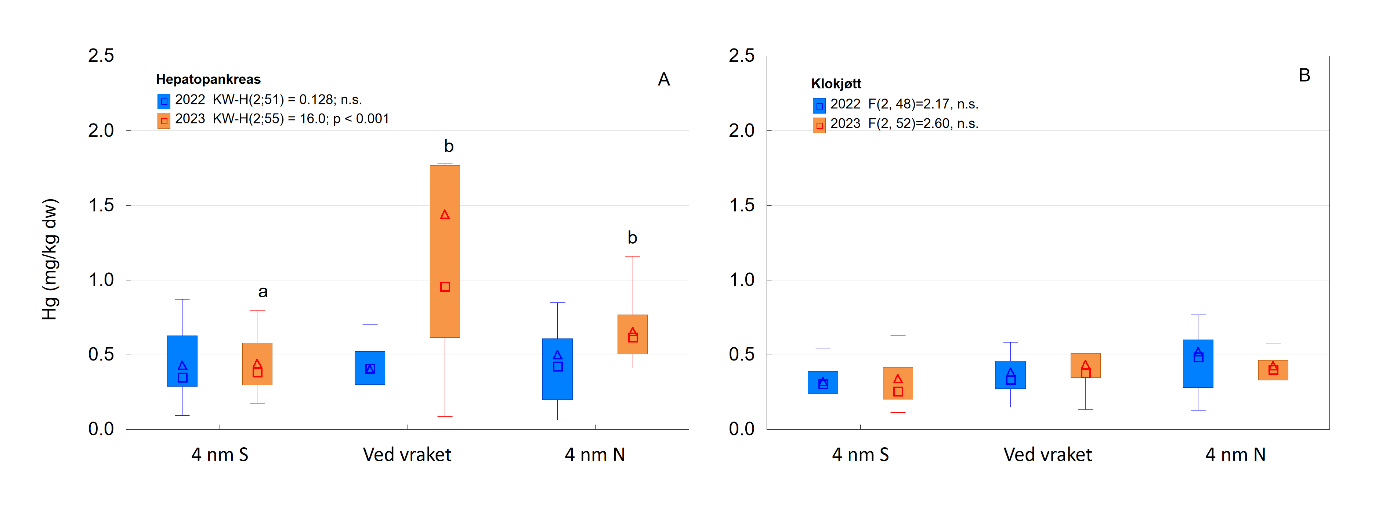
Figure 4. Comparison of Hg dry weight concentrations (Hg, mg/kg dry weight) in crab (Cancer pagurus) tissue between different localities; at the wreck of U-864 (“ved vraket”), four nautical miles south of the wreck (4 nm S) and four nautical miles north of the wreck (4 nm N). Results are given for hepatopancreas (A) and claw meat (B) of raw crabs sampled in 2022 (blue) and 2023 (orange), respectively. Boxplots show medians (square), means (triangle), 25 percentiles and non-outlier range. Results of Kruskal-Wallis non-parametric analysis or one-way ANOVA are shown for each tissue and year, and different letters above the boxes indicate significant differences between groups.