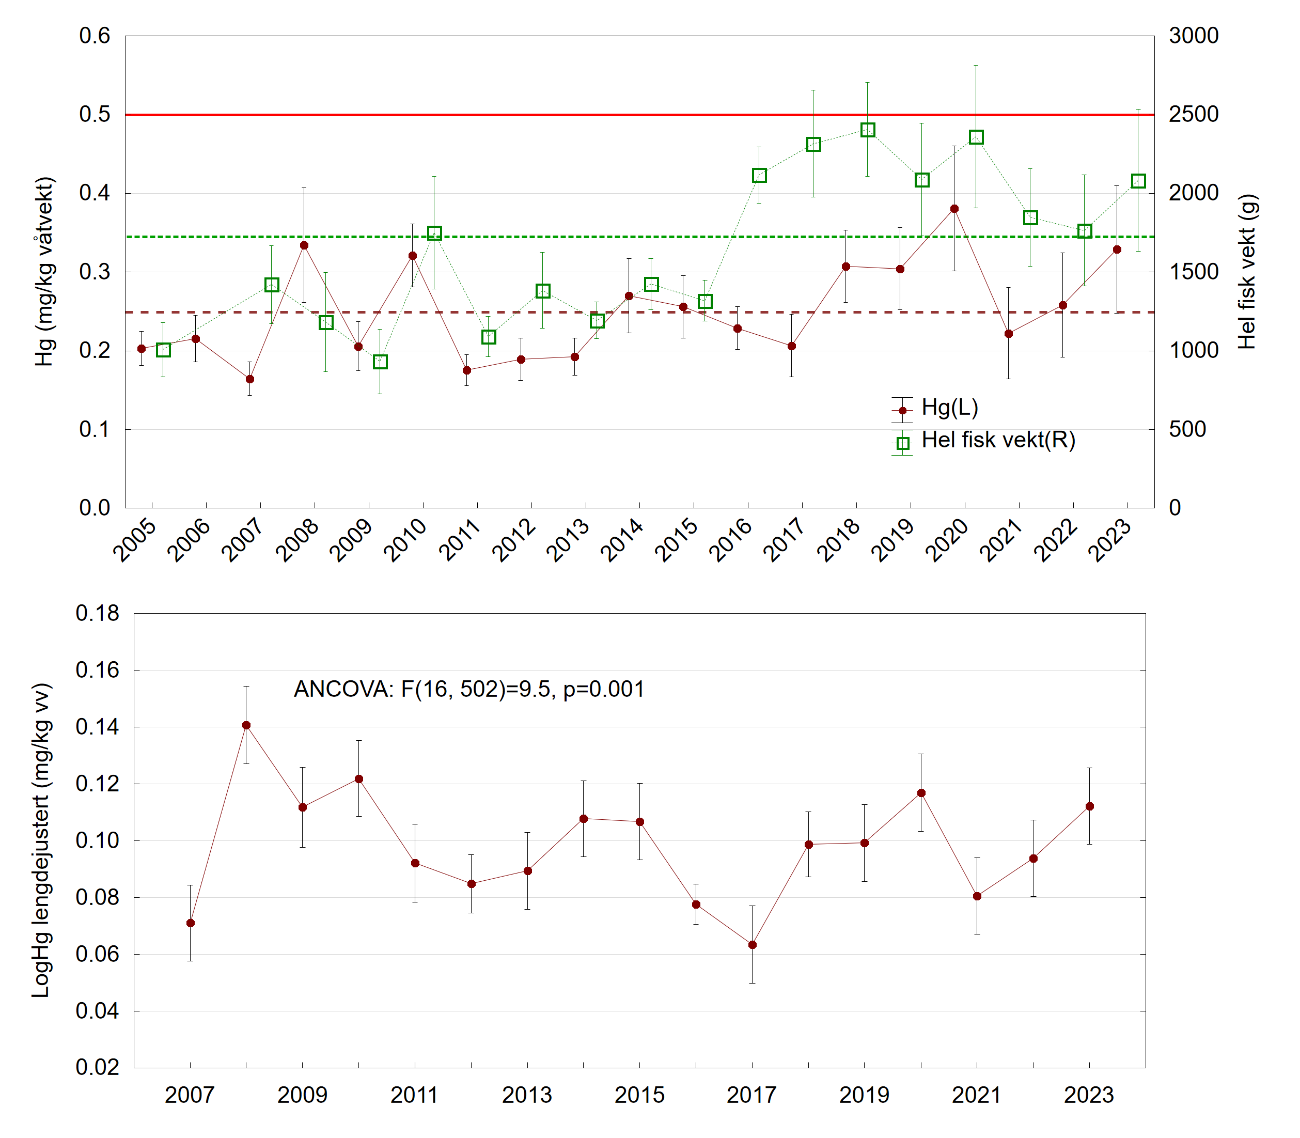
Figure 2. Year to year variation in mercury (Hg) concentrations (mg/kg wet weight, ww) in fillet of tusk (Brosme brosme) caught near the wreck of U-864. Top: Concentration of Hg (mg/kg ww, left) and fish weight (g, right) every year from 2005-2023. For each year, mean ± 95% confidence intervals are given. The long term mean values (2005-2023) are shown as dotted horizontal lines for Hg (maroon) and for fish weight (green). EU and Norway’s maximum level for Hg is marked with a continuous red line. Bottom: Length adjusted Log10 Hg (Least square means) per year (2007-2023) obtained by ANCOVA with fish length as covariate. ANCOVA results are shown.