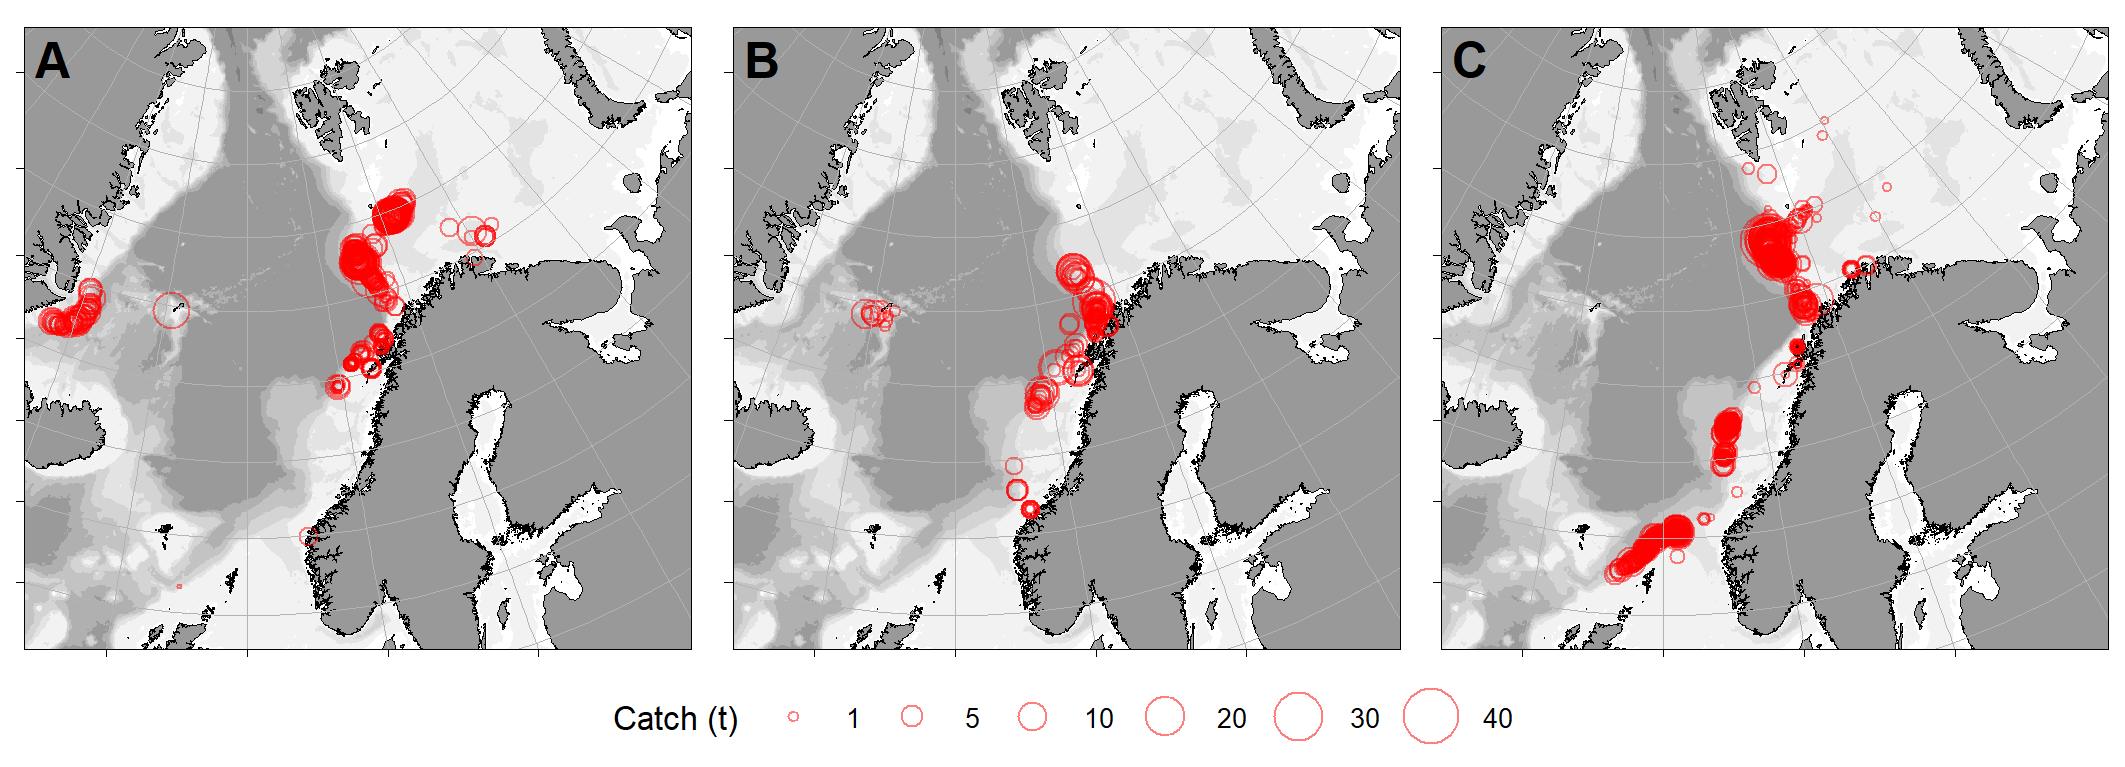
Figure 8.3. Spatial distribution of catches where Greenland halibut make more than 50% of the total catches, according to Norwegian electronic logbooks from 2023. Bubble area is proportional to the size of single catches expressed in metric tonnes. The panels show longline (A), gillnet (B) and trawl (C) catches.