Gå til hovedinnhold
Havforskningsinstituttet
HI
English
<- Tilbake
Søk
Søk
Søk
View page in English
Figur
Fra rapporten:
Oversikt over fiskeri- og prøvetaking i botnfisksektoren i 2023
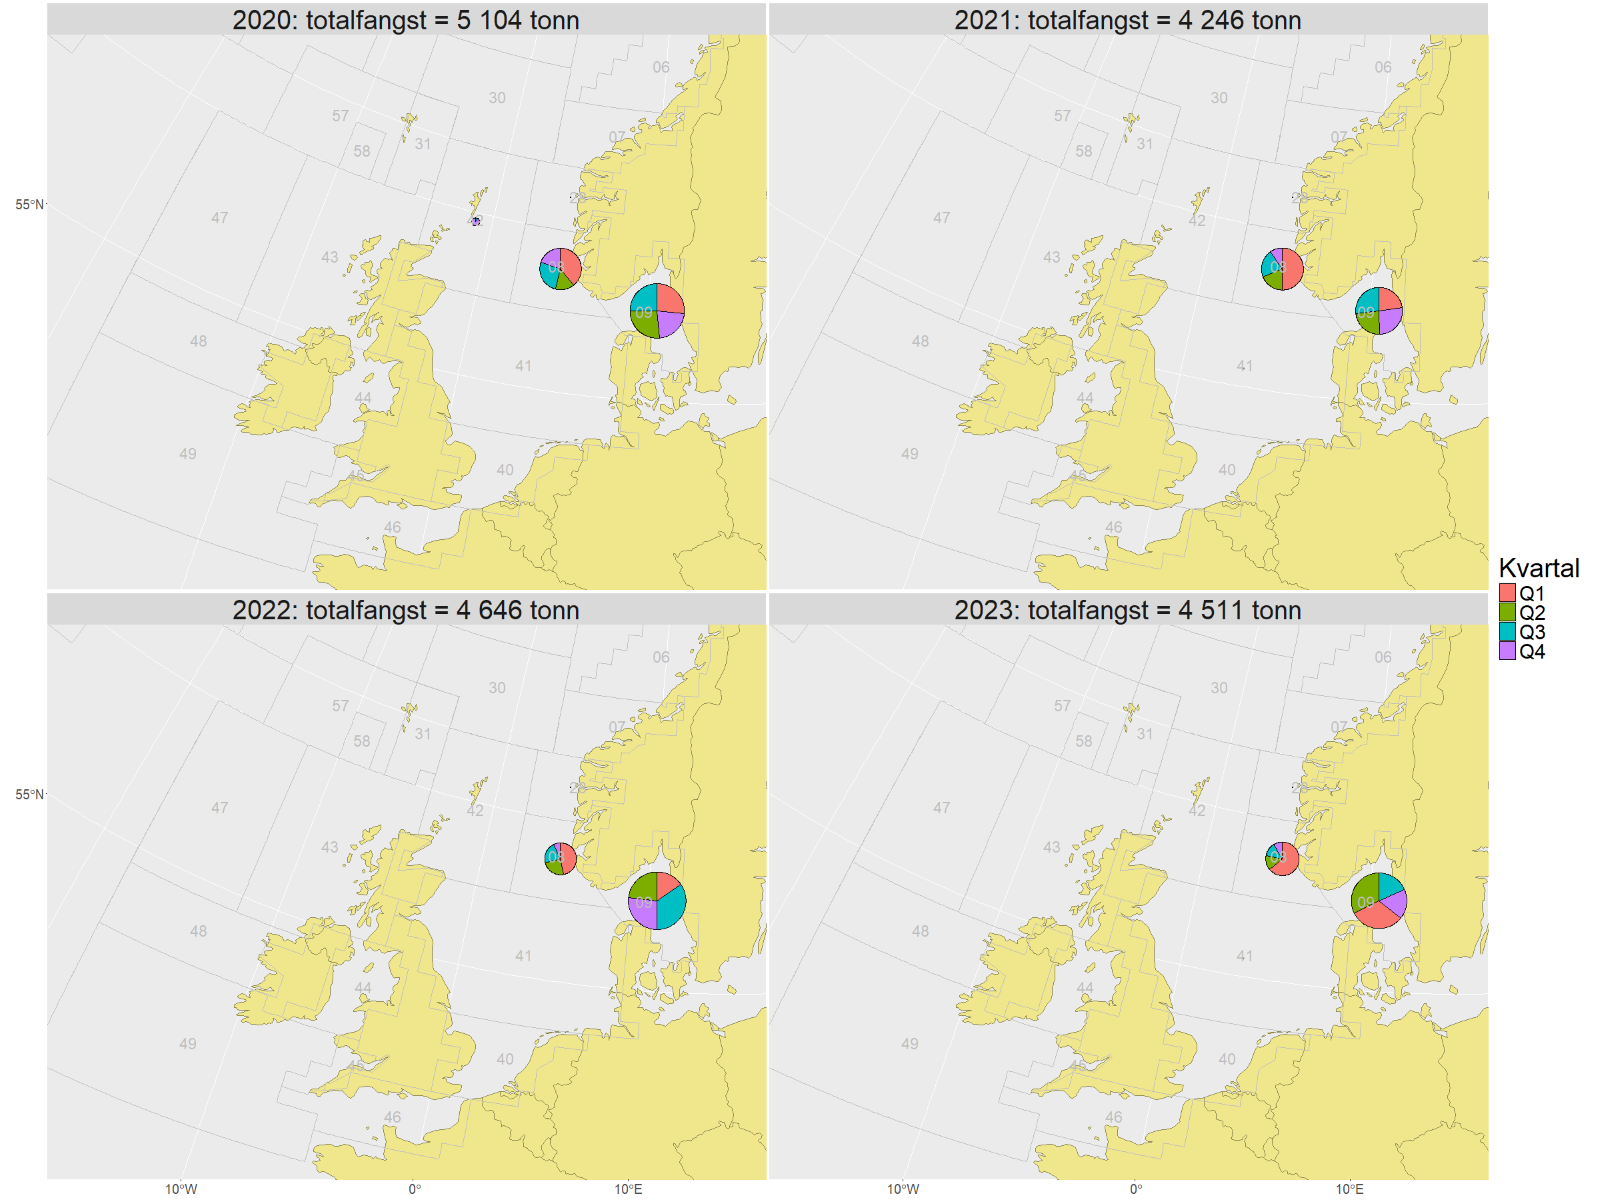
Figur 61. Kakediagram over norske landingar per hovudområde og kvartal 2020-2023.