Gå til hovedinnhold
Havforskningsinstituttet
HI
English
<- Tilbake
Søk
Søk
Søk
View page in English
Figur
Fra rapporten:
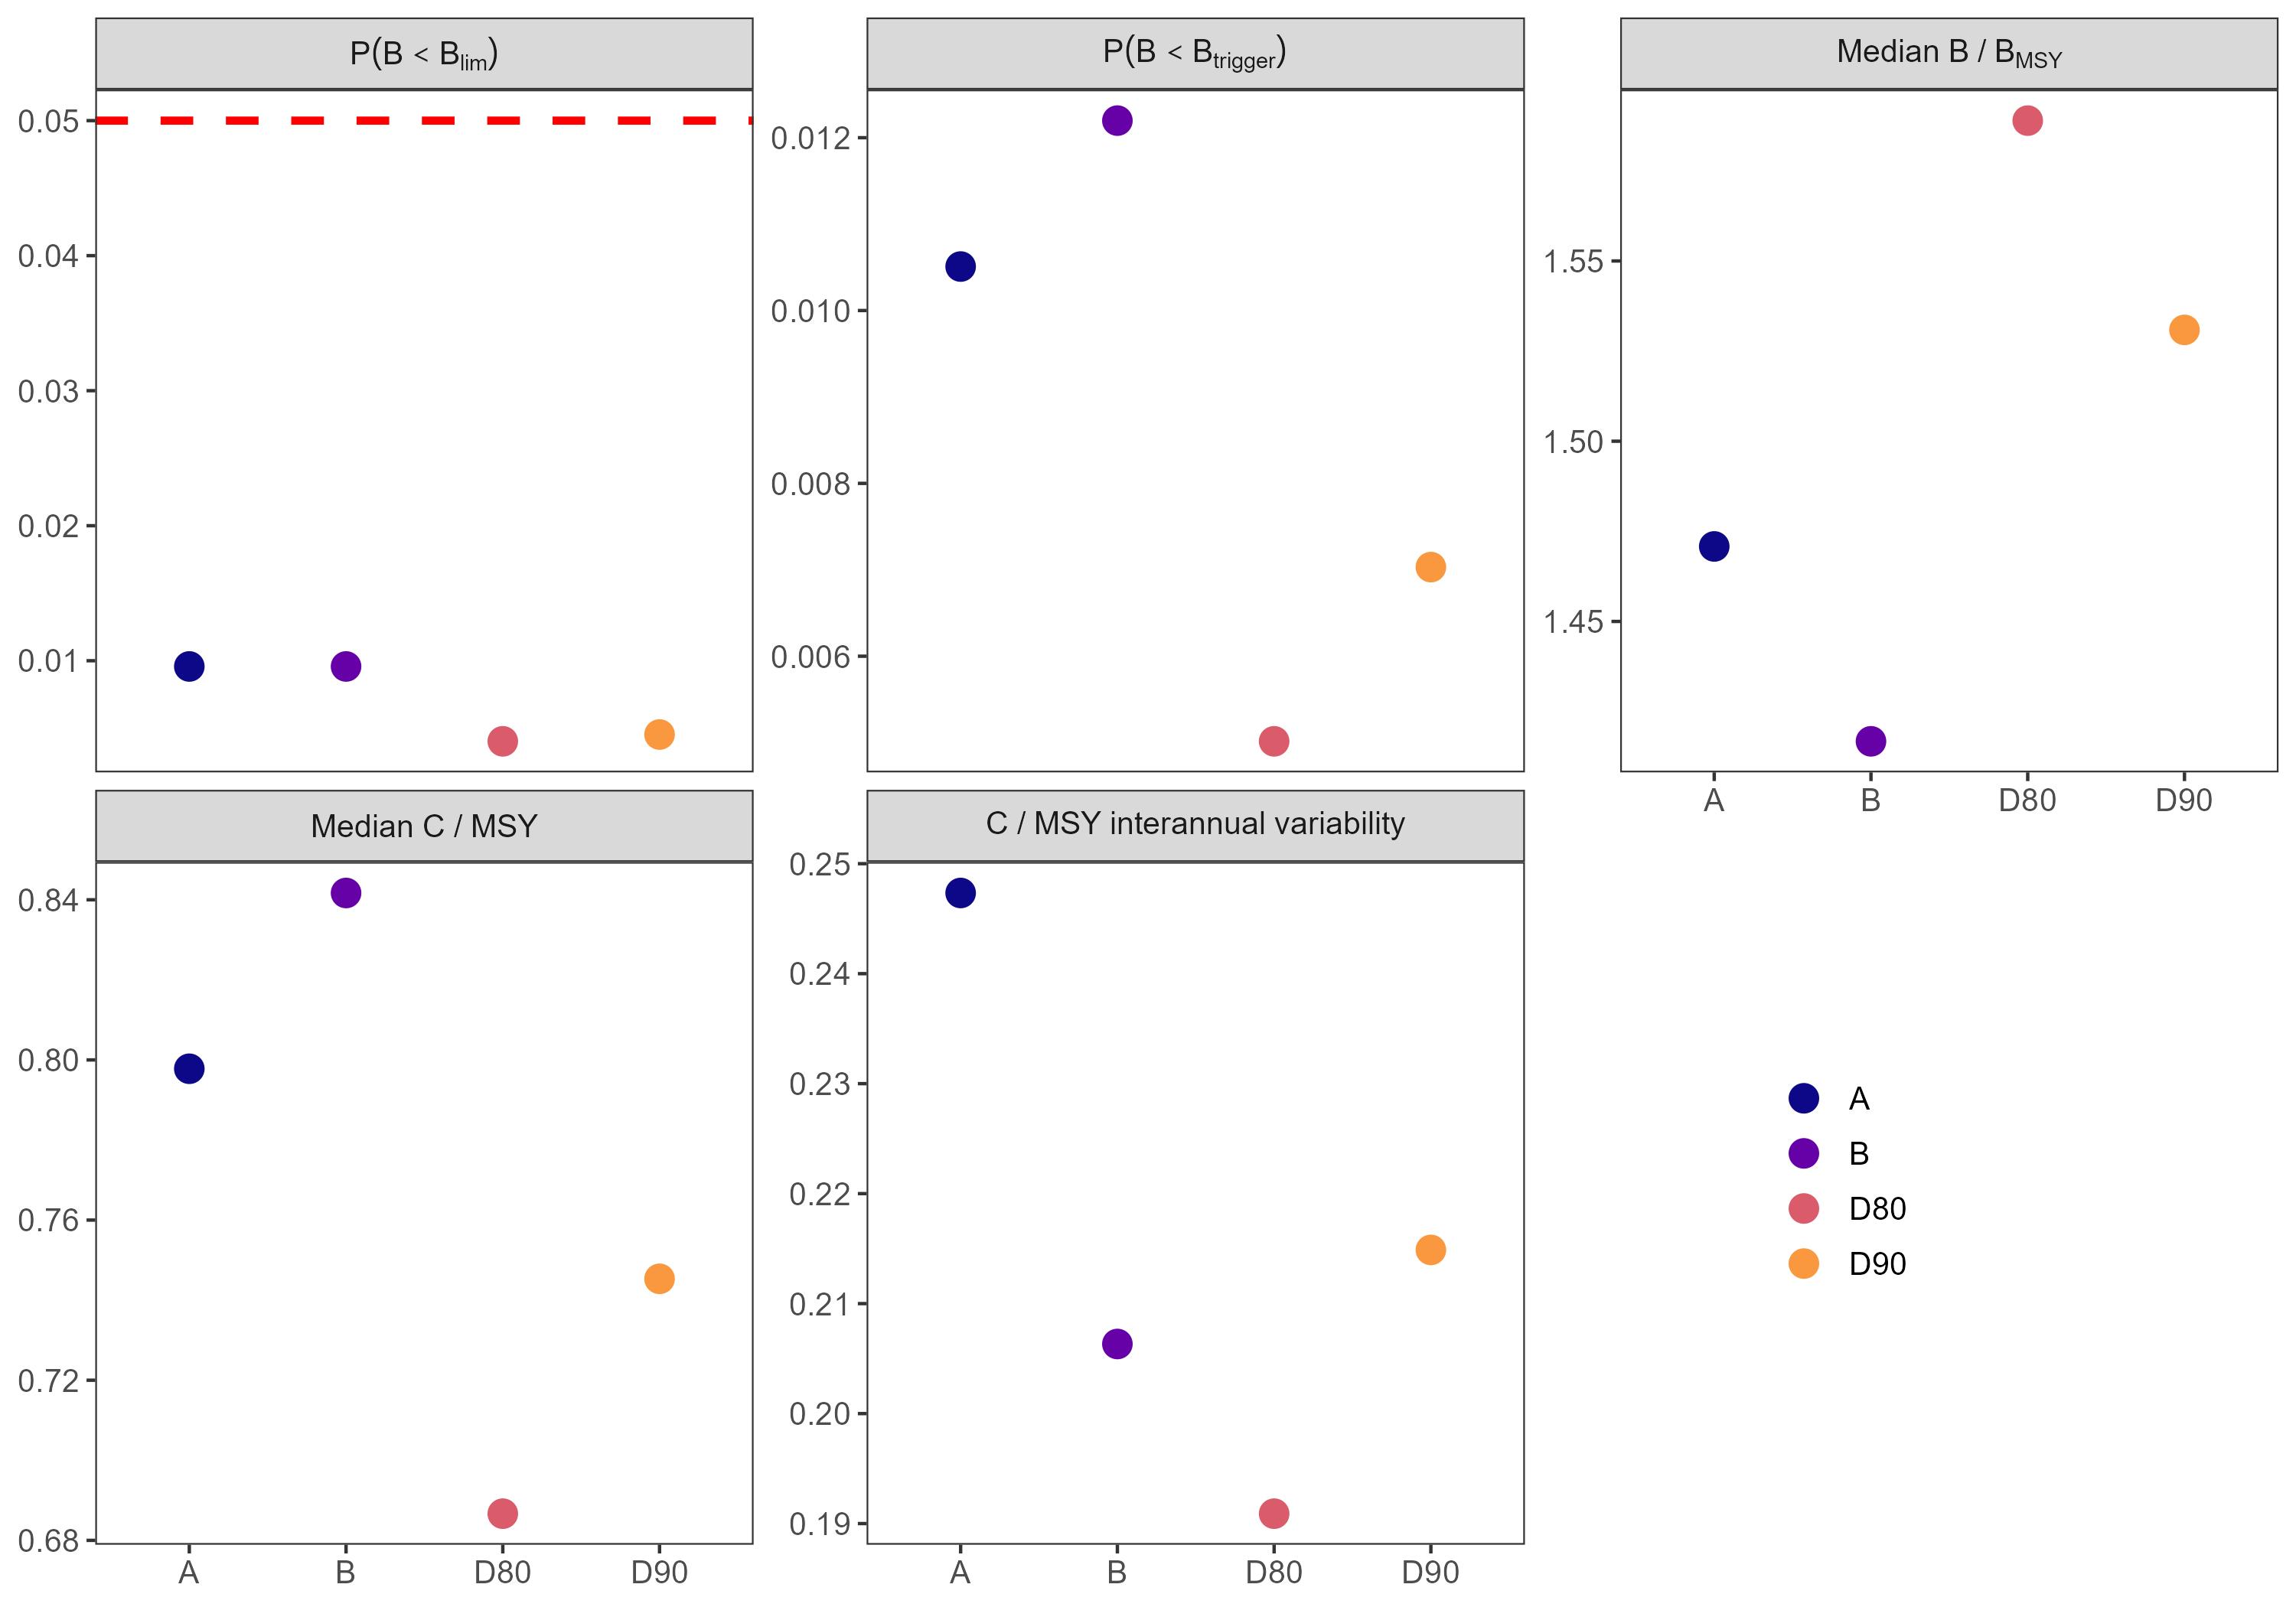
Management strategy evaluation for northern shrimp in the Barents Sea (ICES subareas 1 and 2)
Figure 13: Performance of each HCR (those that were precautionary under OM1) under OM2 in the period after the reduction in carrying capacity.