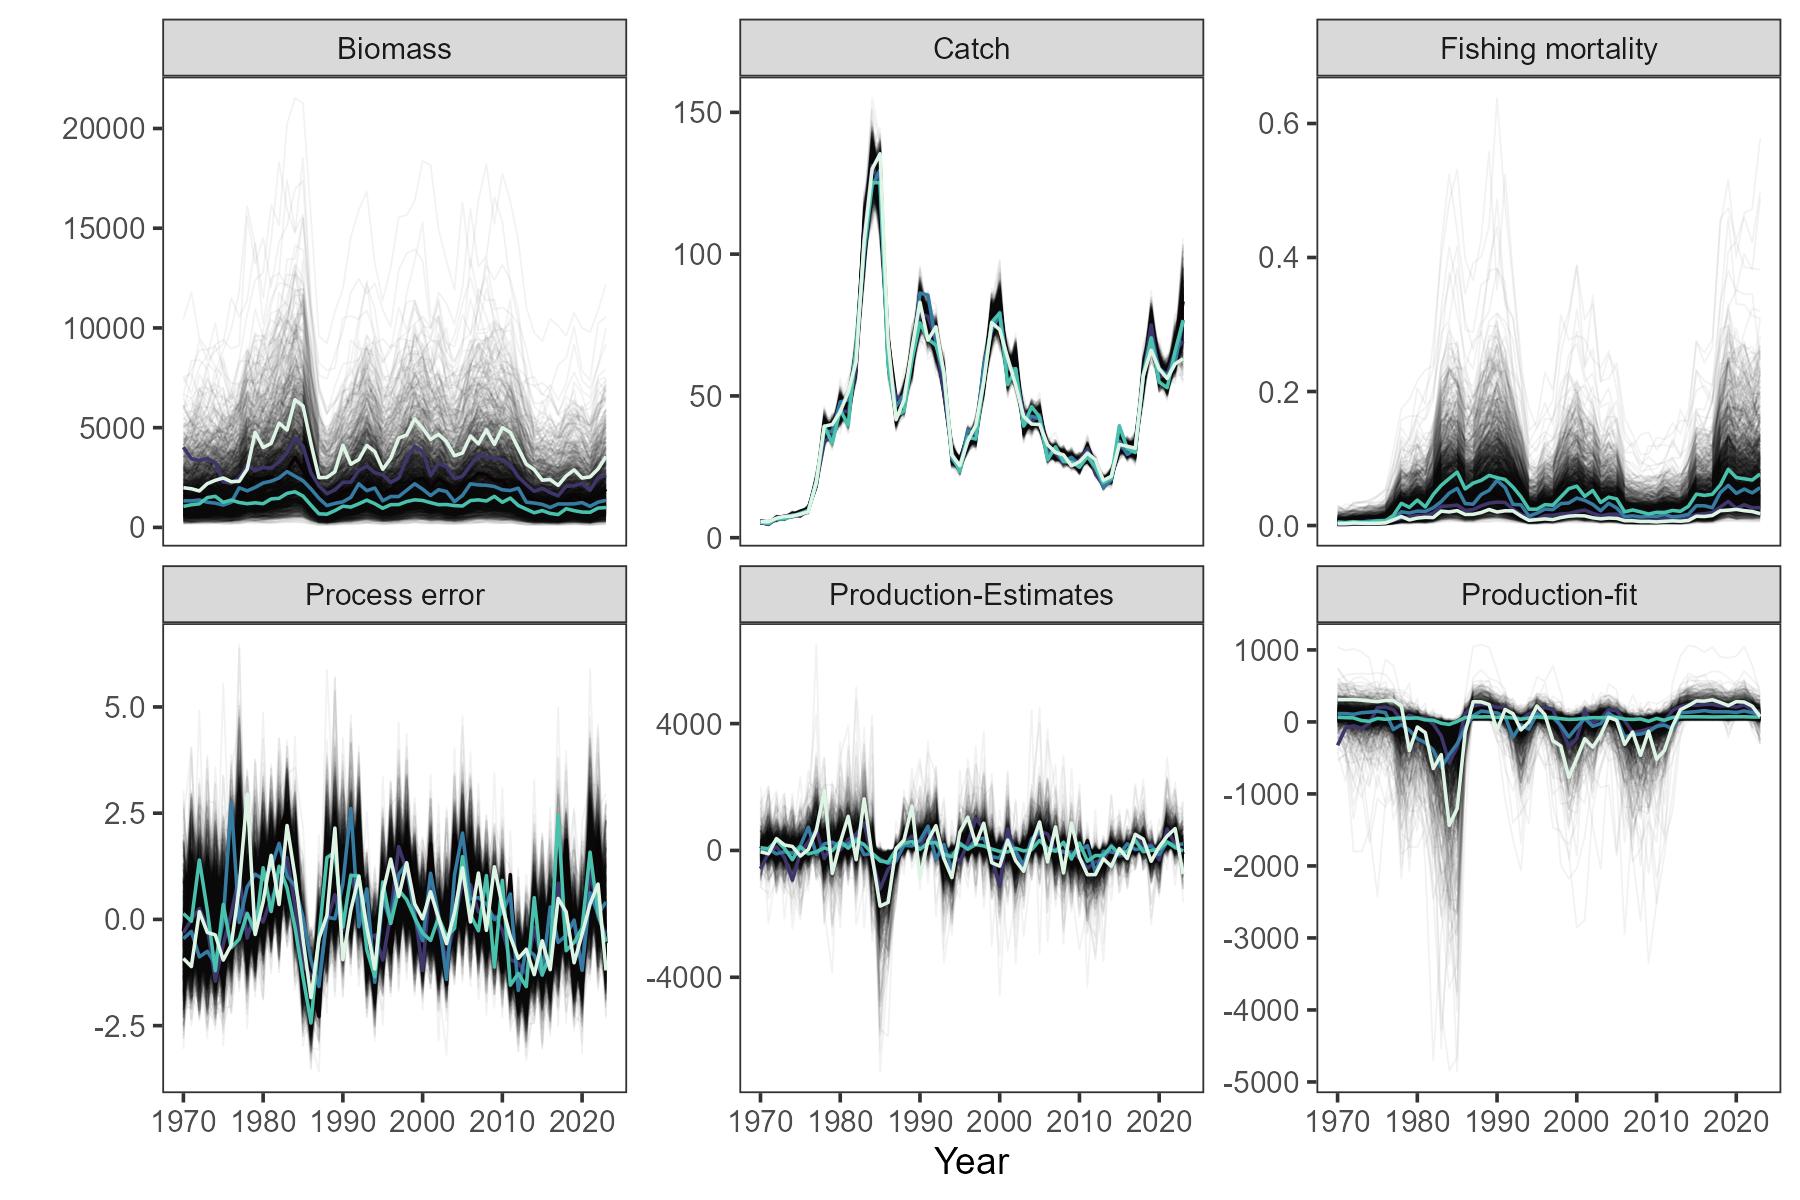
Figure 3: Simulated historical trajectories of shrimp biomass, fishing, surplus production, and process error around production curve, based on parameter uncertainty from SPiCT. A total of 2000 trajectories were simulated (black), and a random subsample of five trajectories are shown in color.