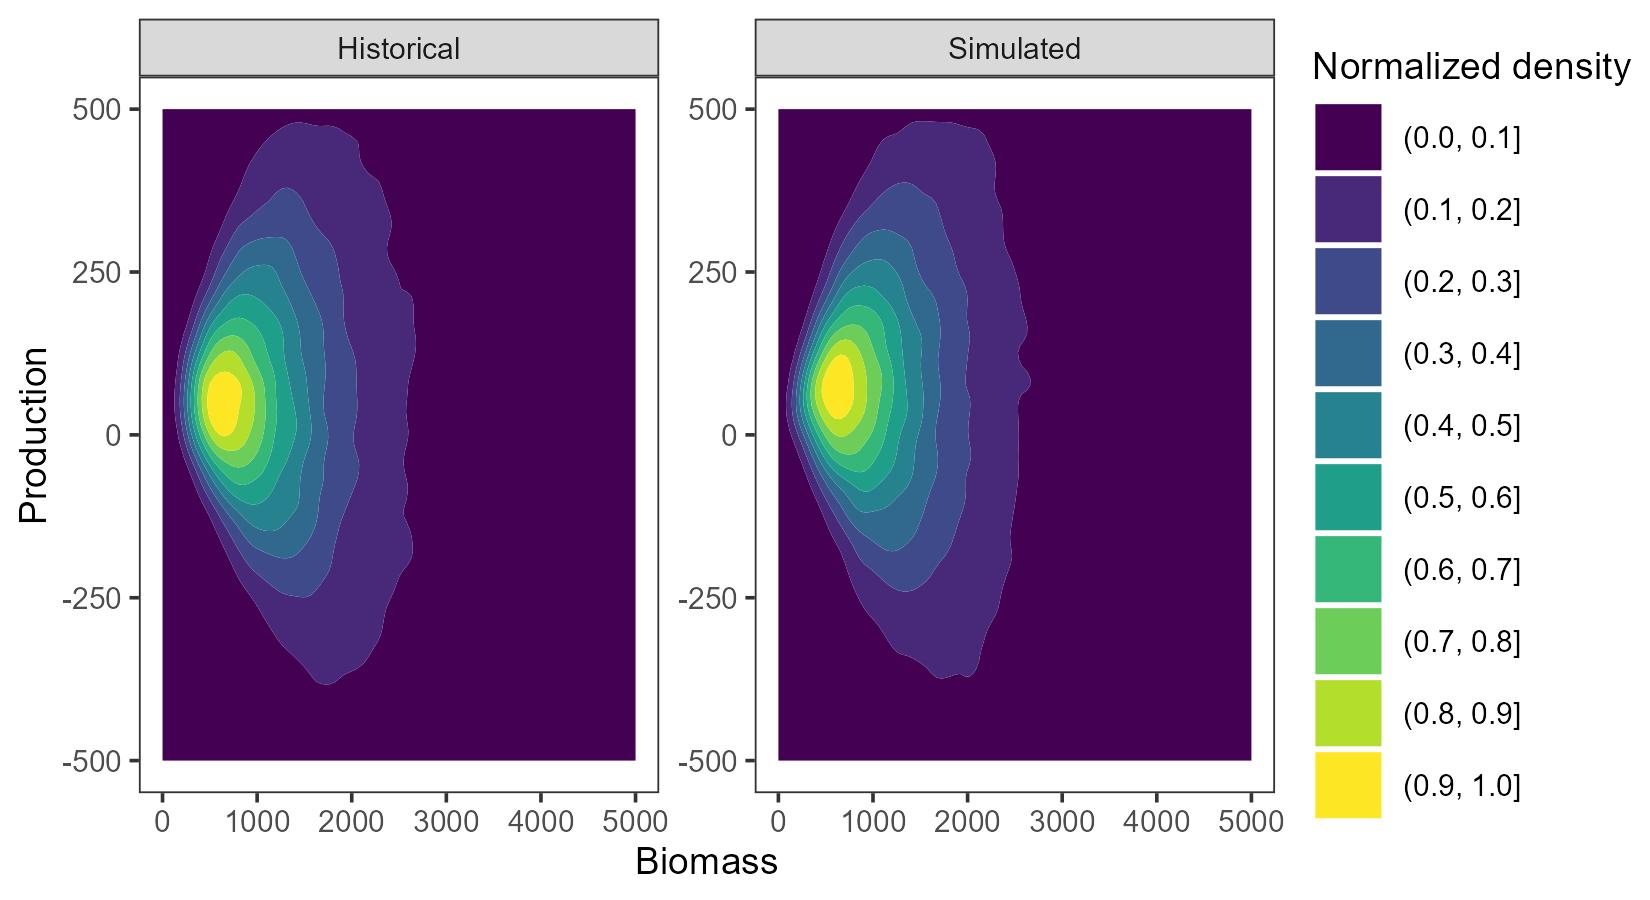
Figure 4: Two-dimensional kernel density estimation of shrimp production as a function of biomass. The left plot shows the density surface of estimates of the historical surplus production-biomass pairs (left) resulting from random parameter sets and estimated process errors (i.e. conditional random effects) generated from parameter uncertainty and correlation (i.e. the joint precision matrix estimated within SPiCT). The right plot shows the density surface of production-biomass pairs resulting from simulated process errors (and random parameter sets) used in the operating model.