Gå til hovedinnhold
Havforskningsinstituttet
HI
English
<- Tilbake
Søk
Søk
Søk
View page in English
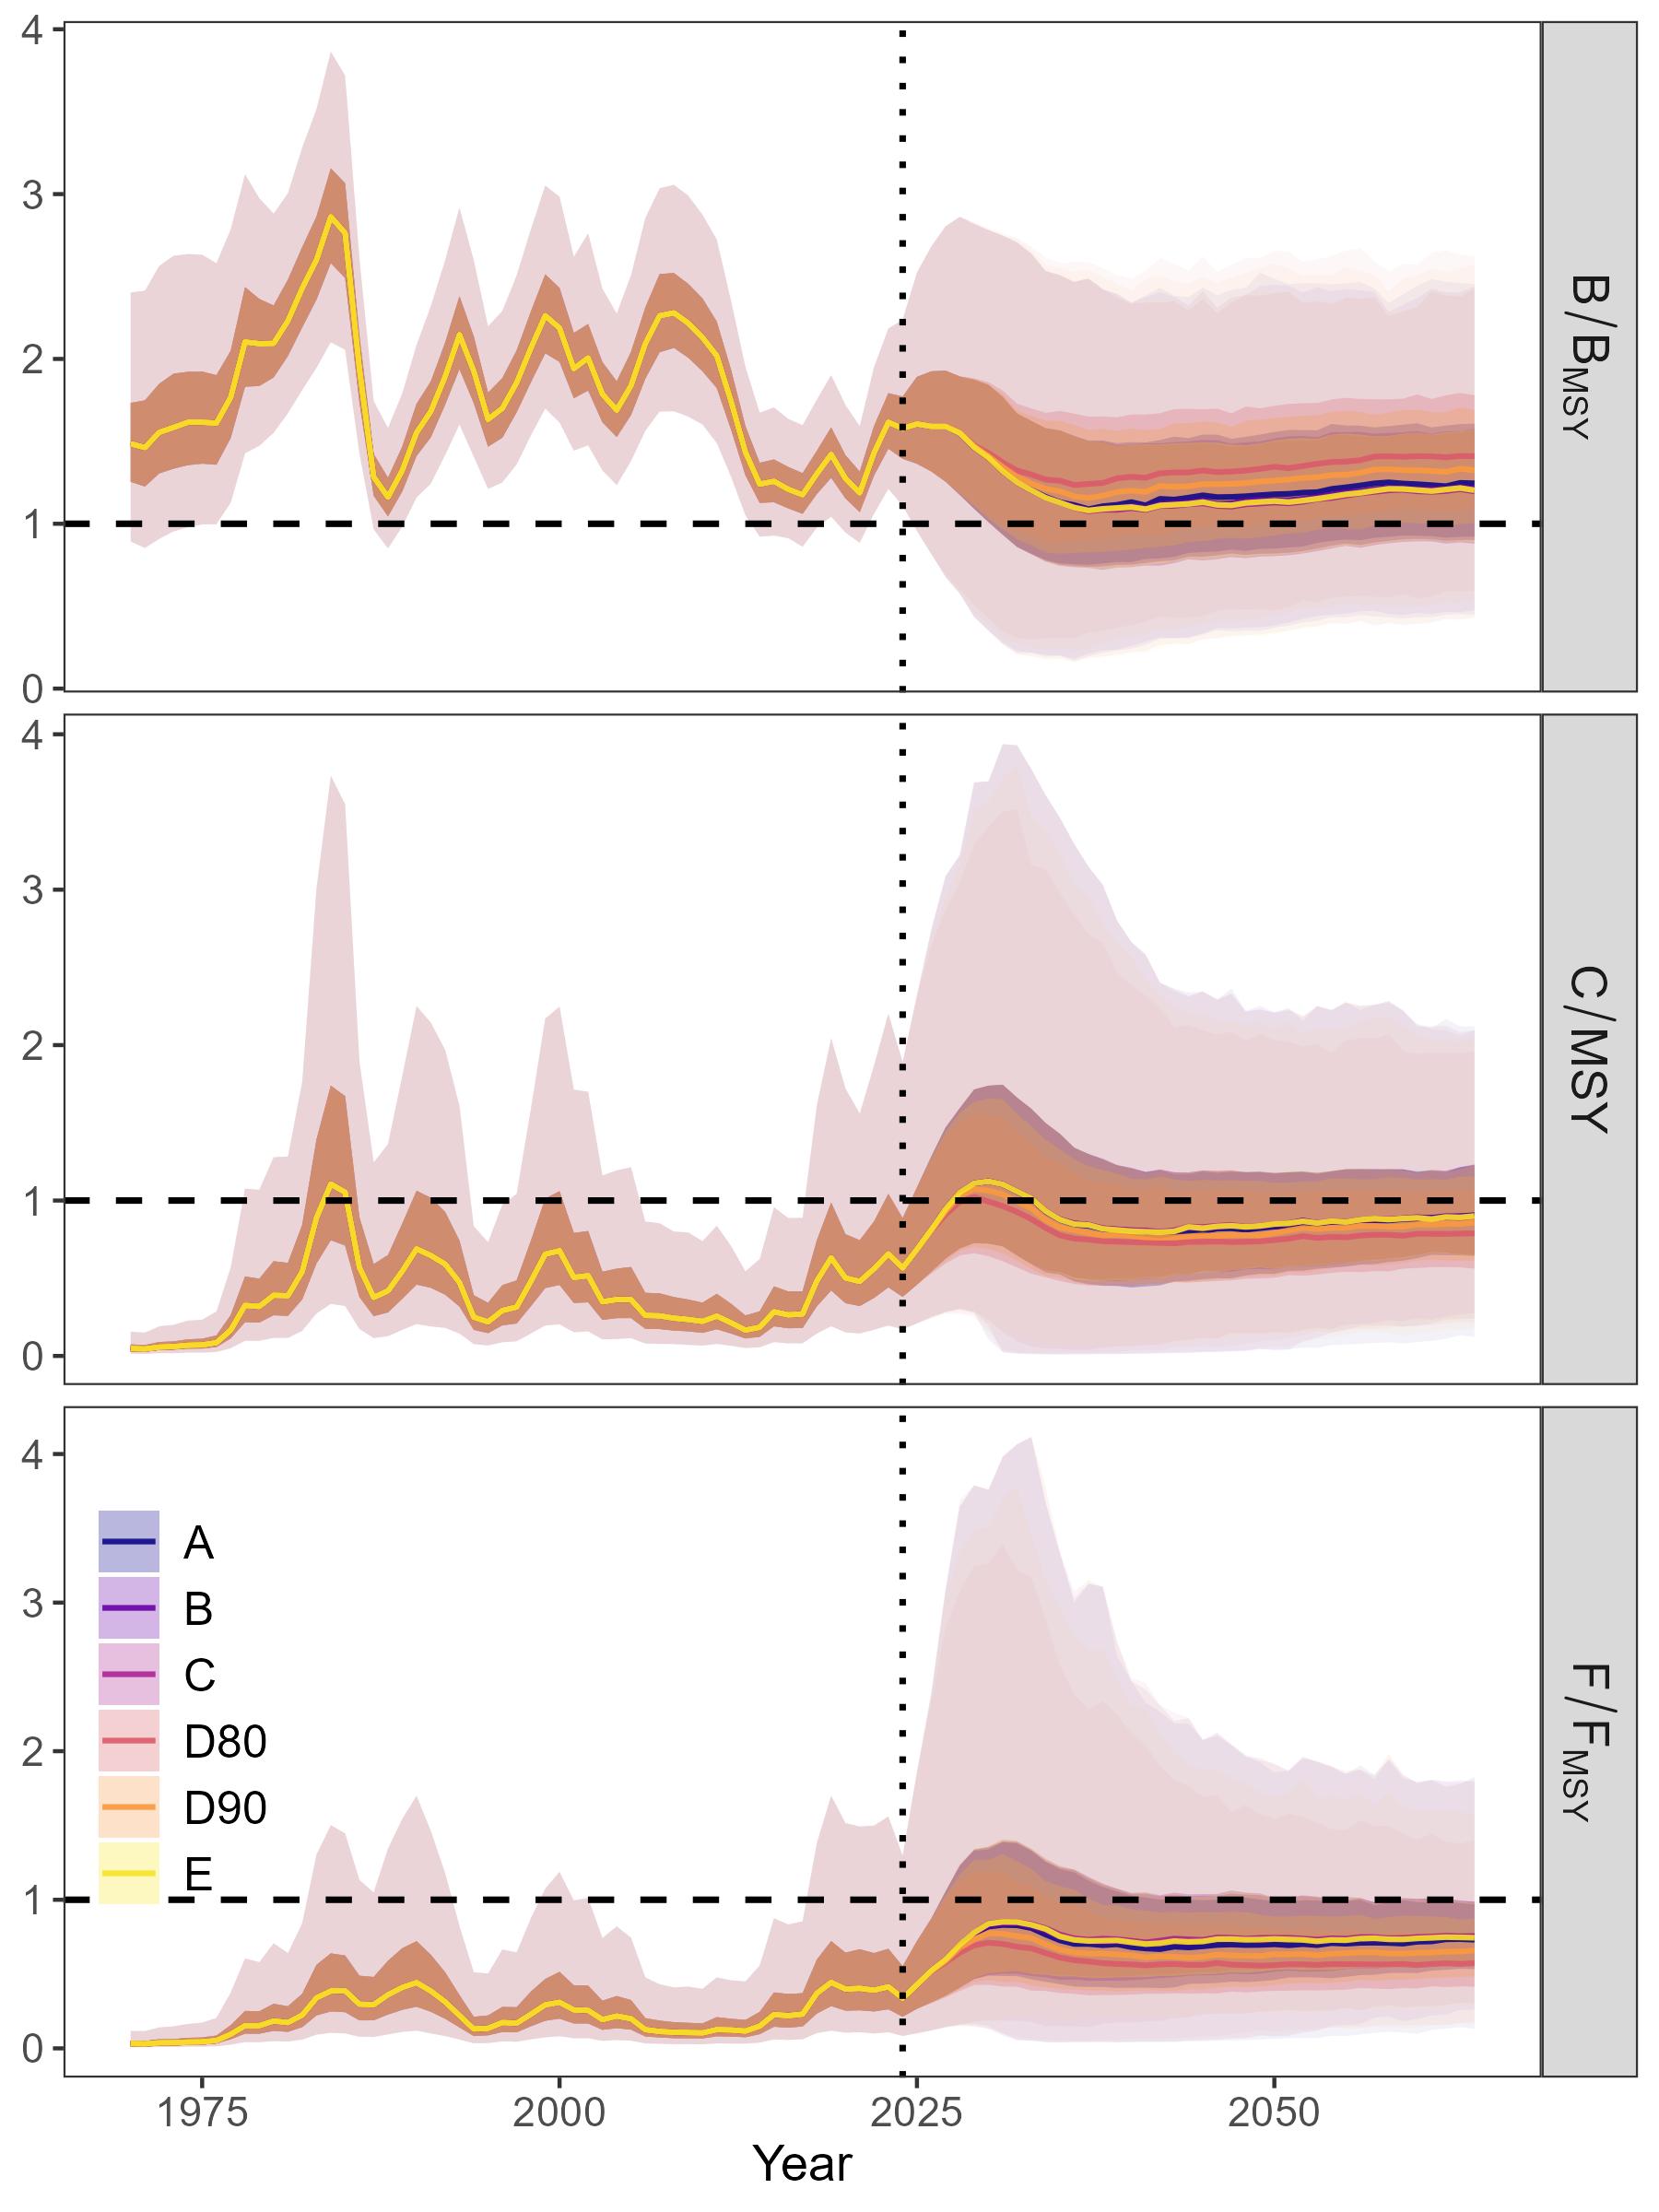
Figur
Fra rapporten:
Management strategy evaluation for northern shrimp in the Barents Sea (ICES subareas 1 and 2)
Figure 7: Historical and future MSE projections of main population and fishing-related metrics with uncertainty for each HCR. The shaded areas show the inner 50th and 95th quantiles. Distributions of the metrics are computed over all iterations.