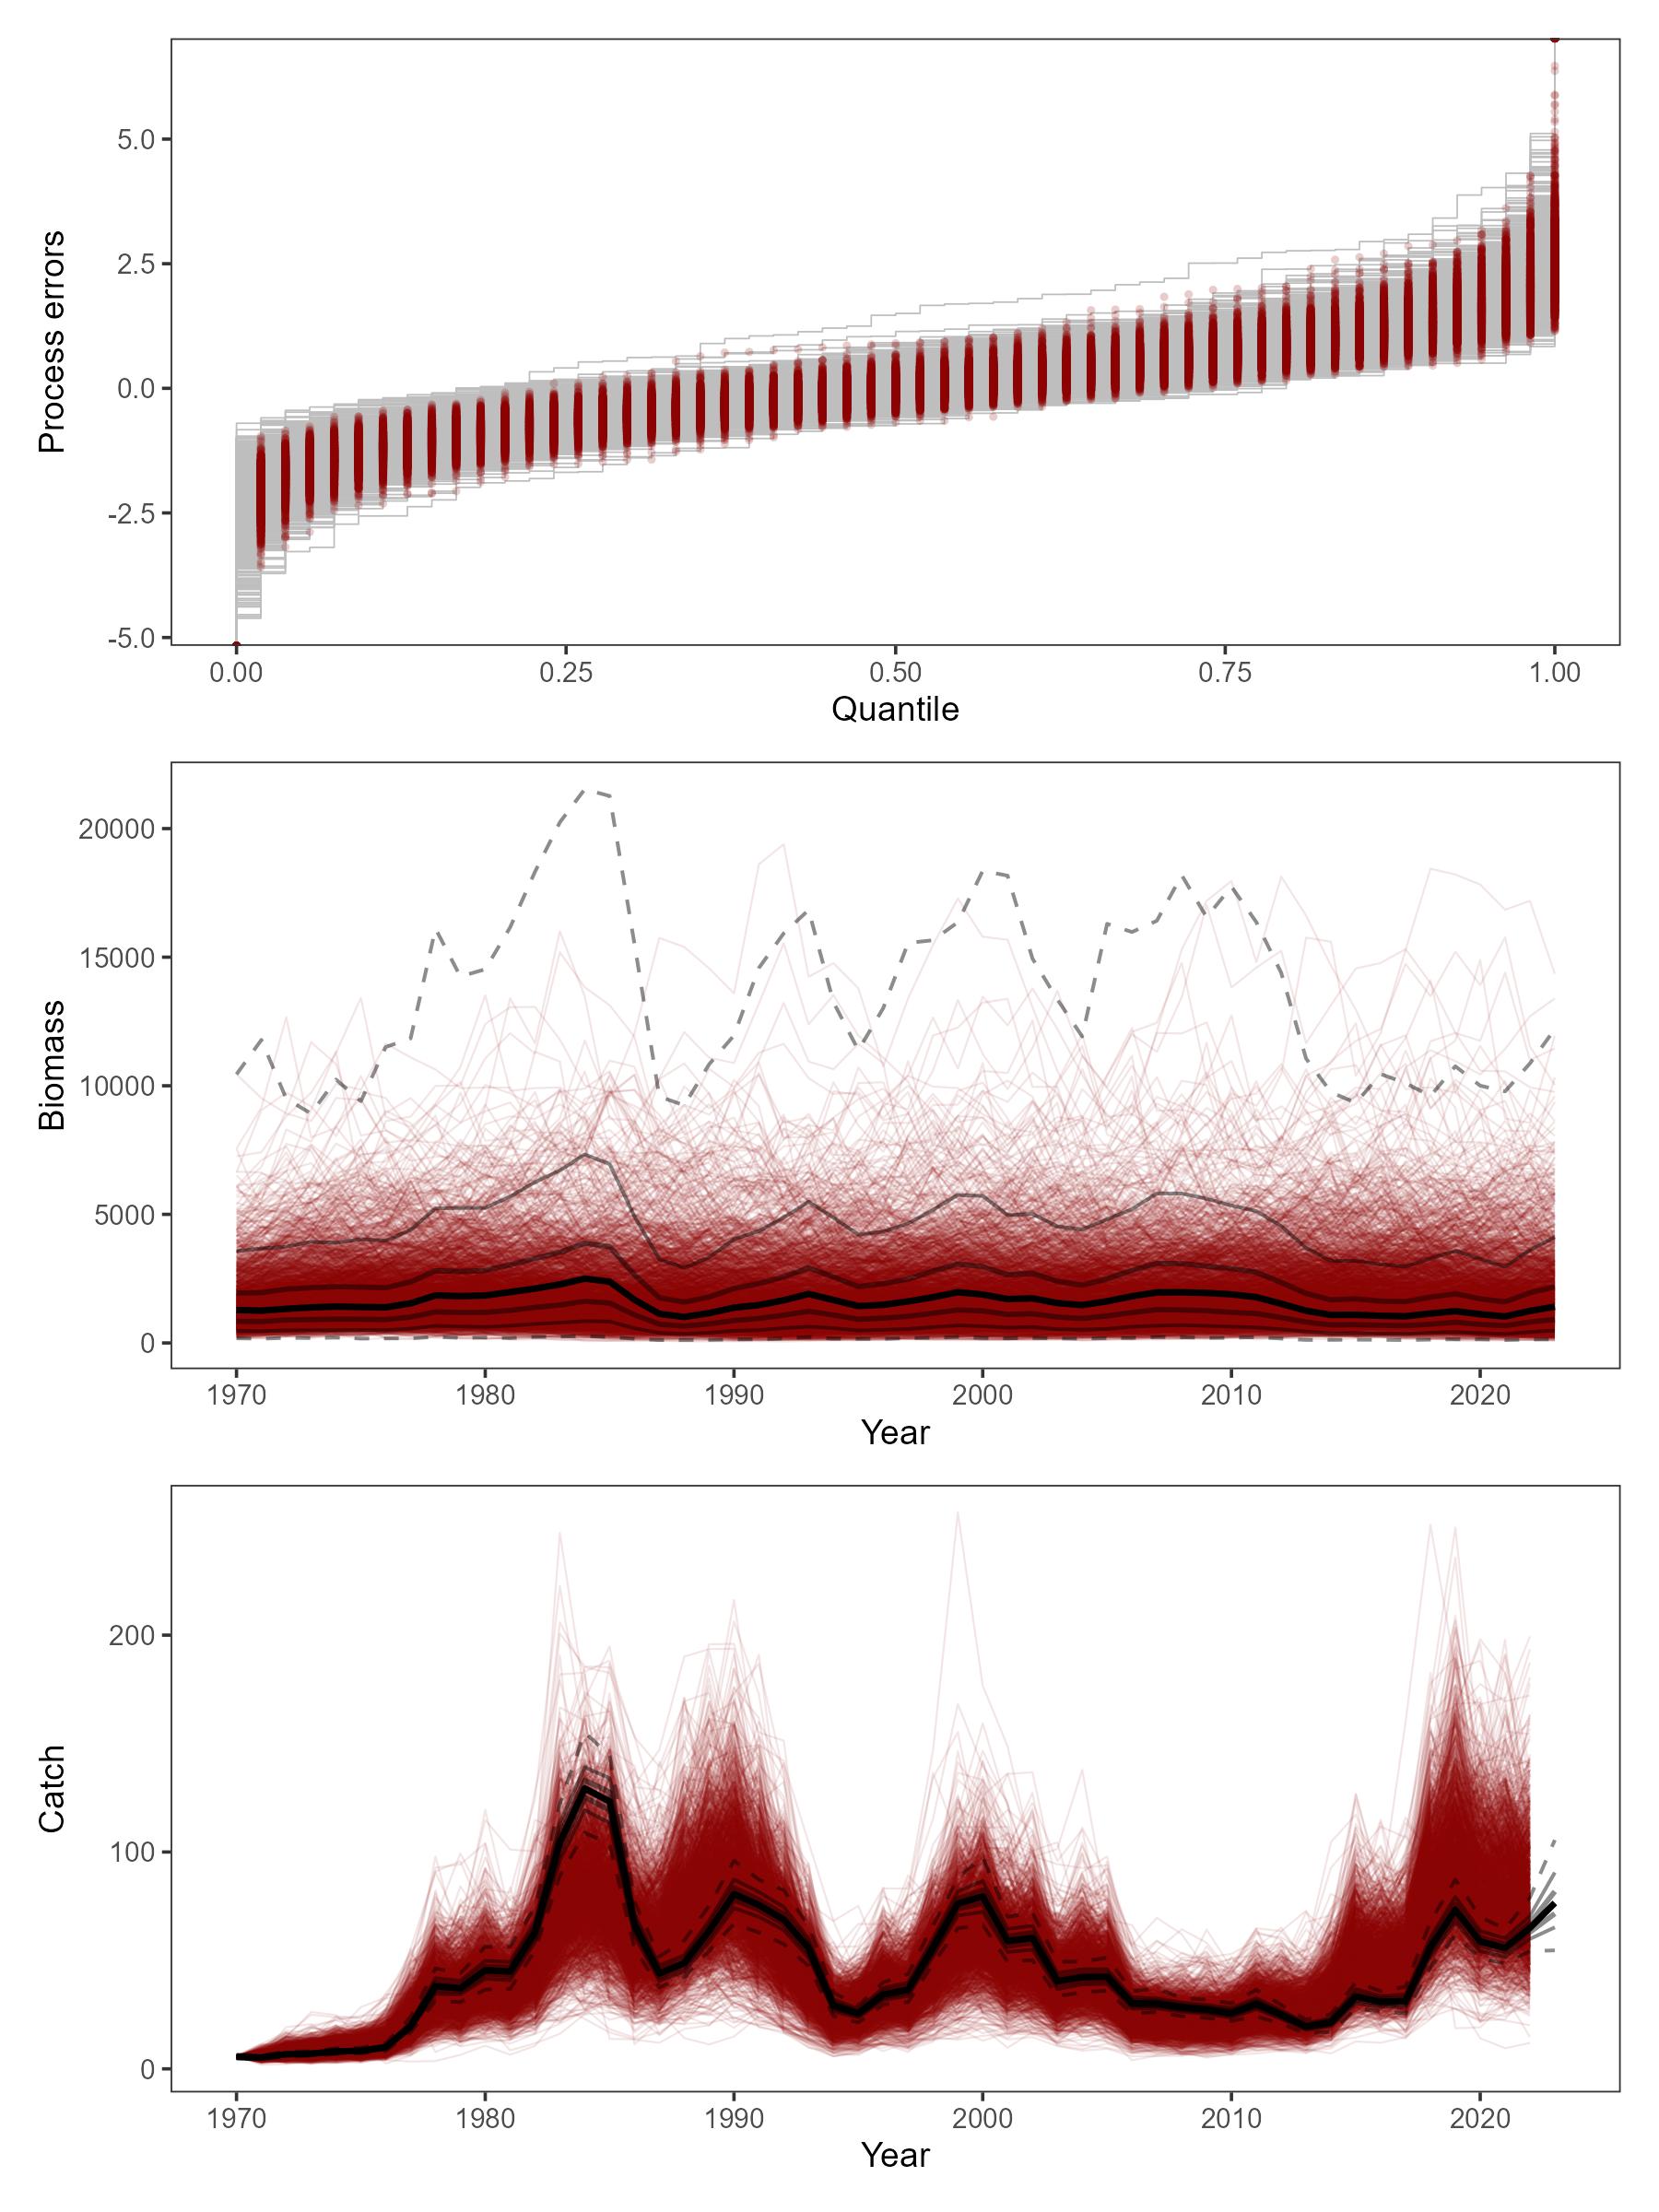
Figure 5: Historical distributions and trajectores generated from parameter uncertainty alone (grey/black), and newly simulated distributions and trajectories generated from parameter uncertainty with new process errors (red). Shown from top to bottom are empirical cumulative distributions for each iteration, historical biomass trajectories for each iteration, and corresponding catches based on uncertainty in fishing mortalities.