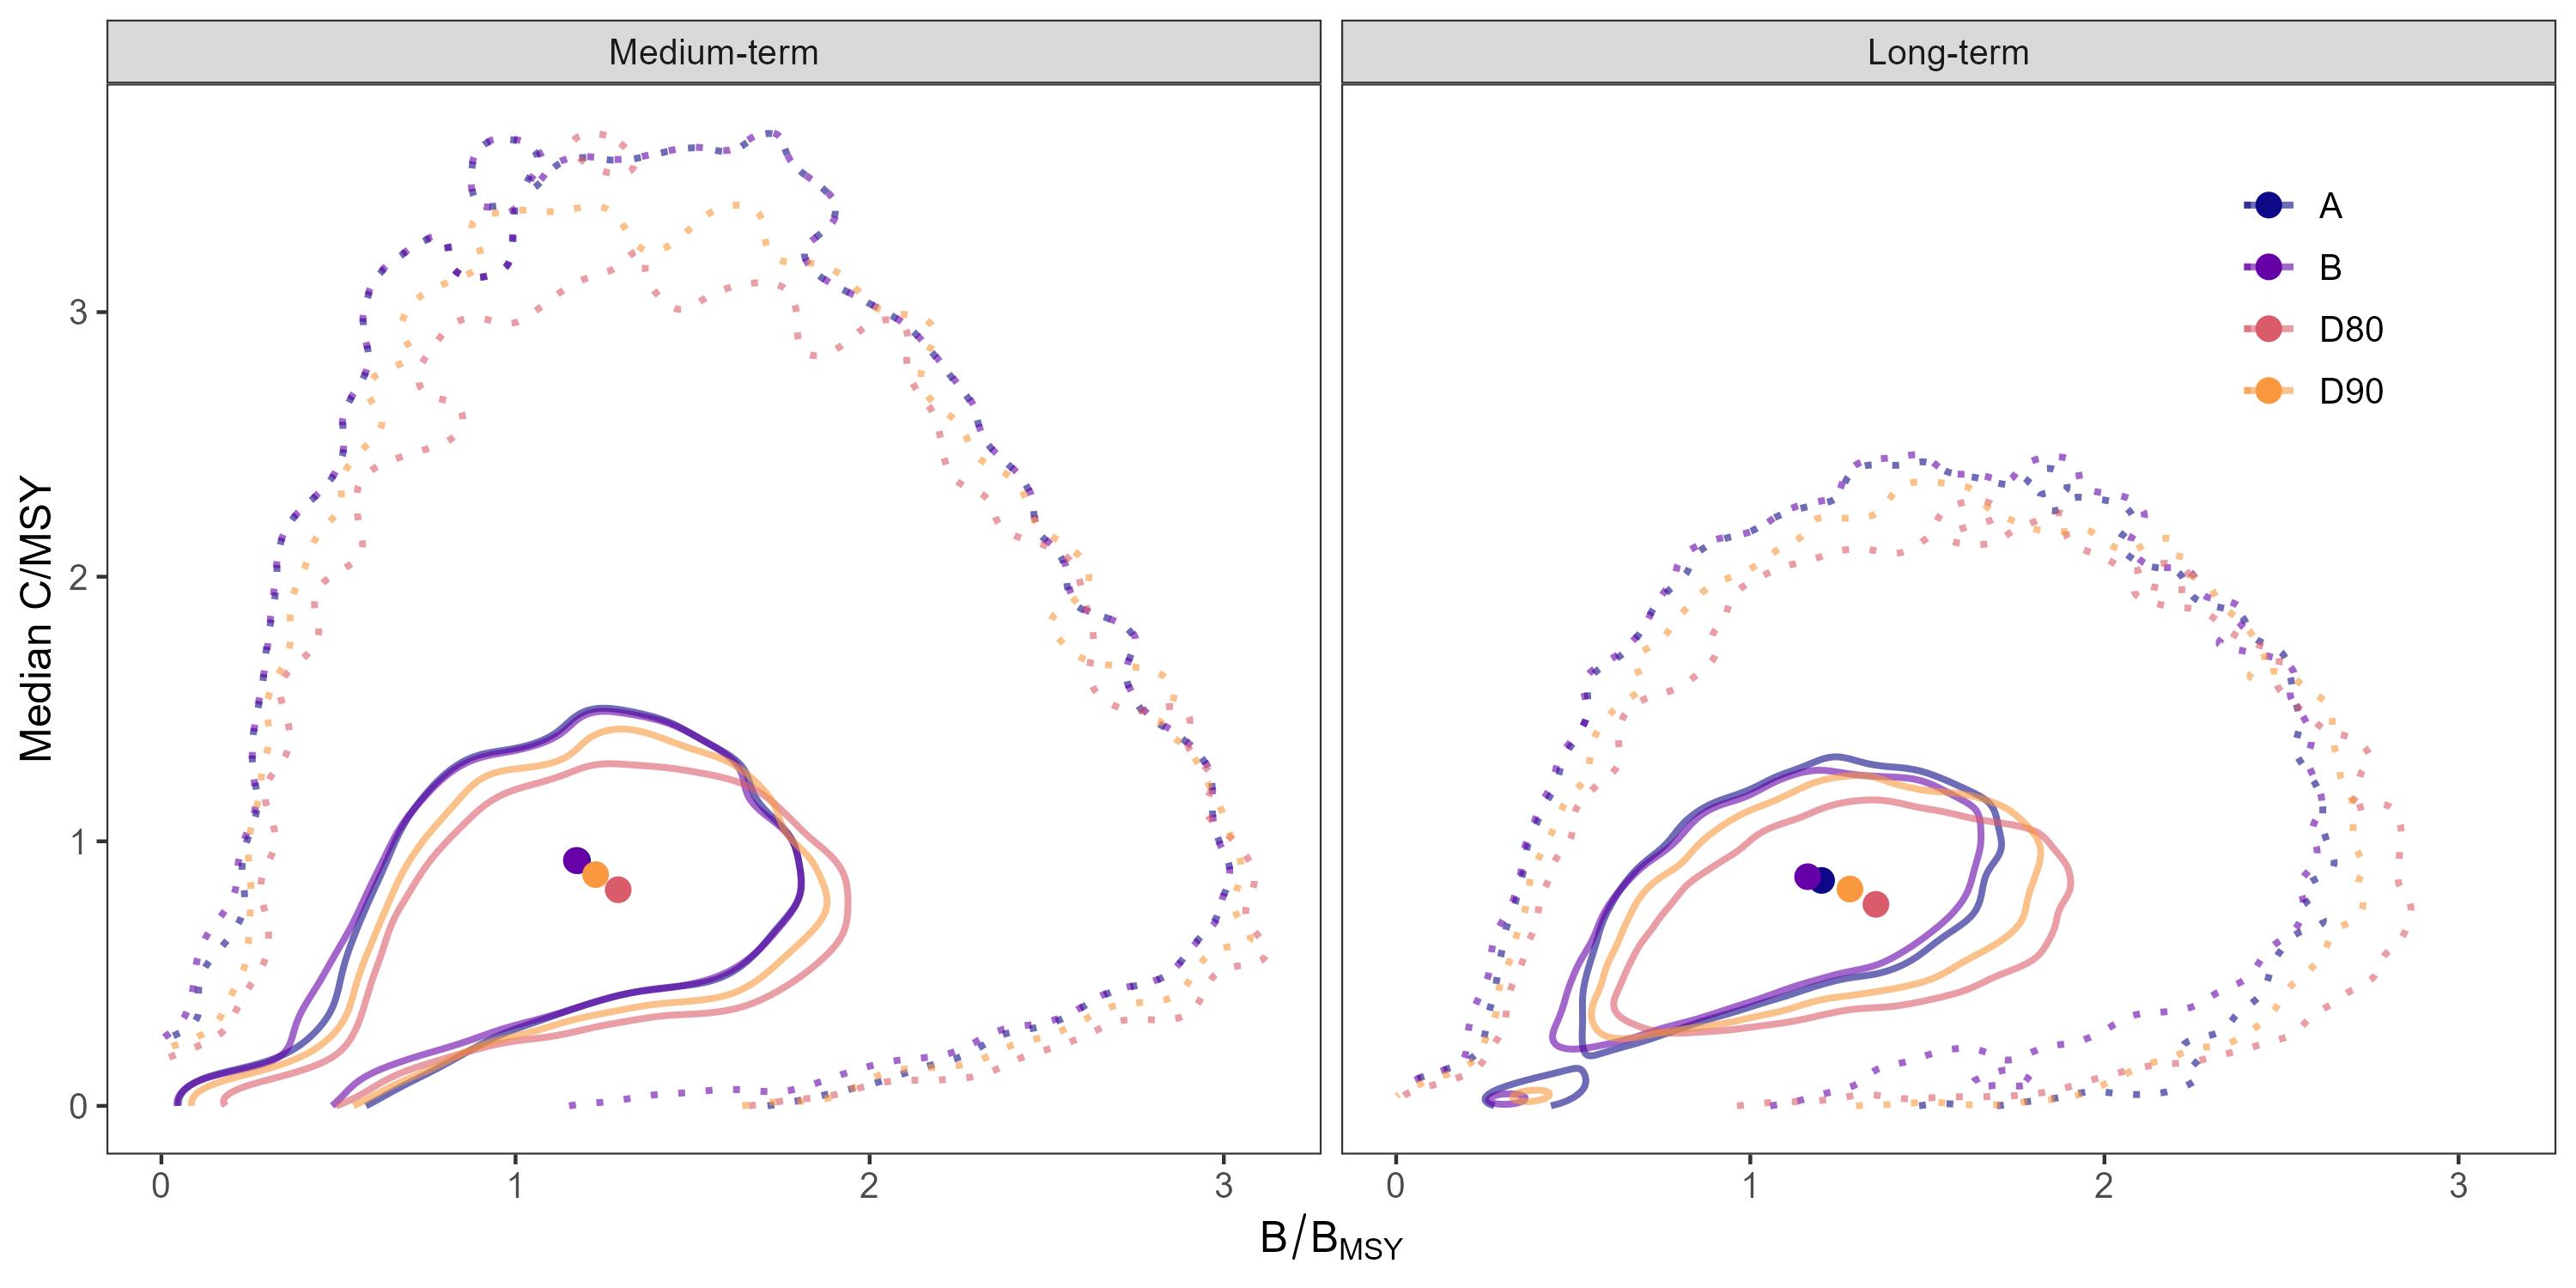
Figure 11: Tradeoff in relative catch (C/MSY) and biomass (B/BMSY) for each HCR in the medium- (2030-2039), and long-terms (2040-2064). The points represents the median relative catch and biomass of all iterations, the inner (solid) contour approximates the inner 50th quantile of the bivariate distribution of iteration specific medians, and the outer (dashed) contour approximates the inner 95th quantile of this distribution.