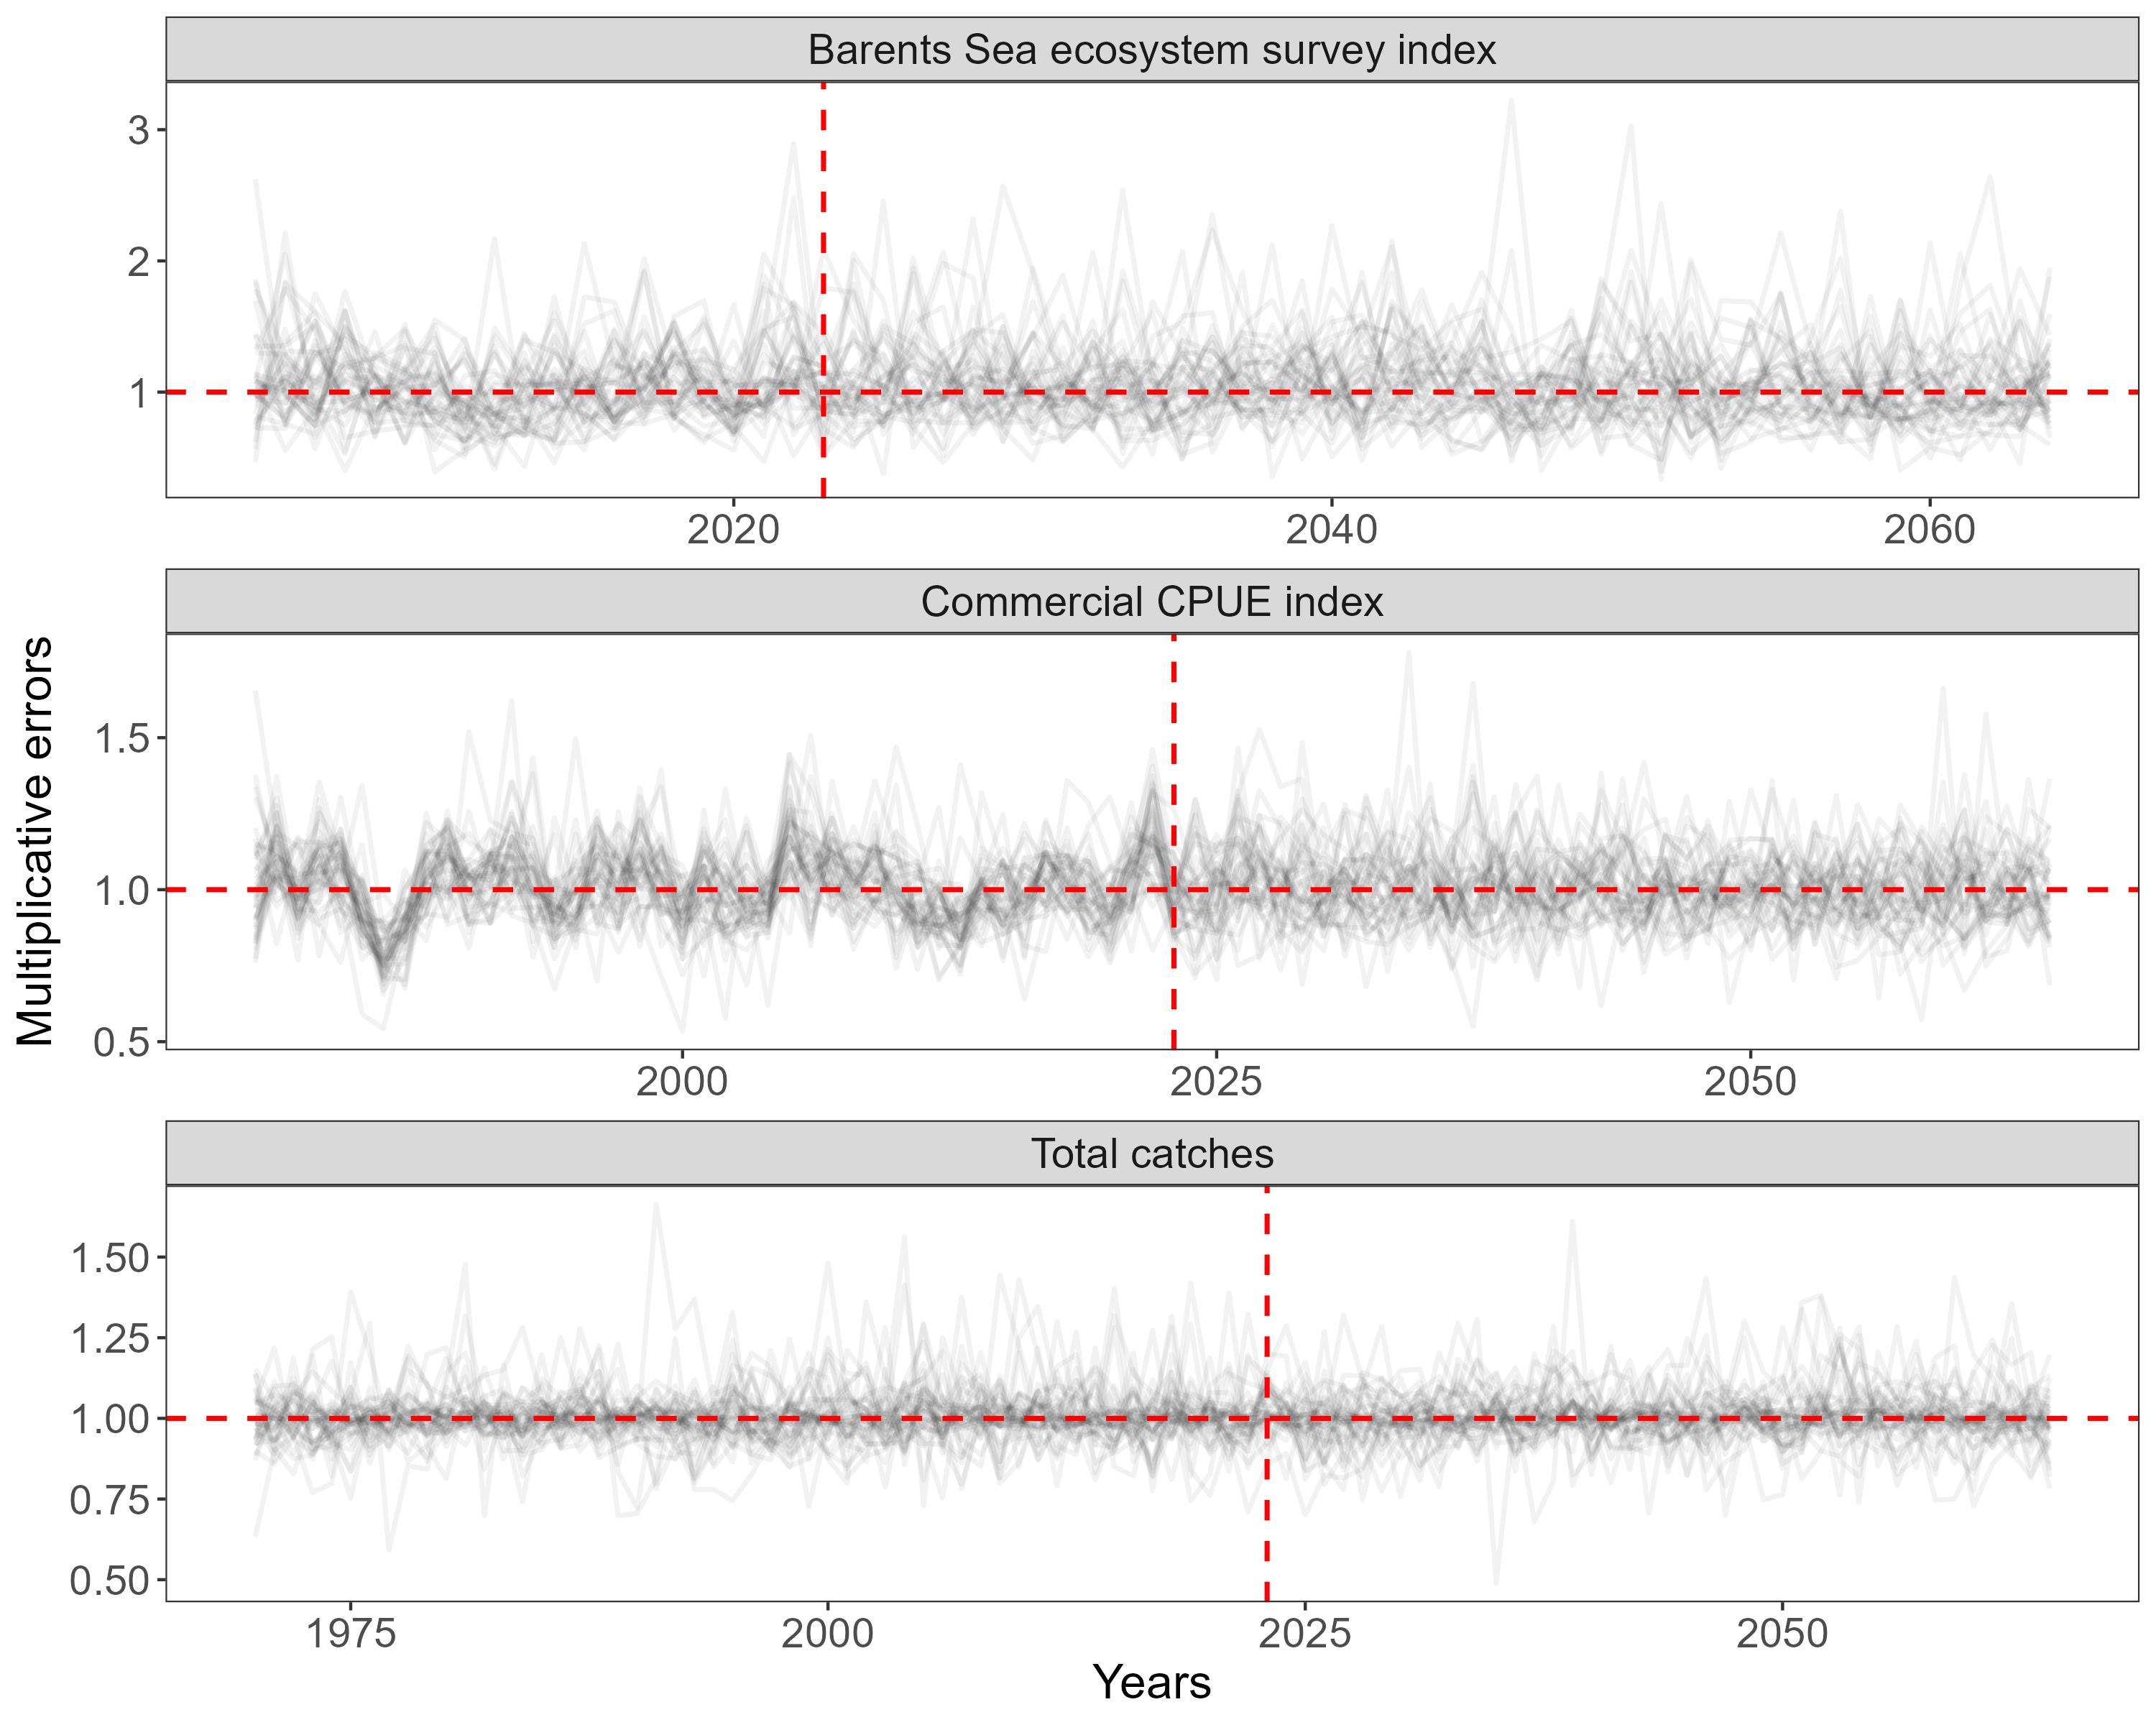
Figure 6: Example simulations of observation error for the two stpcl indices and catches in the observation model. The vertical red dashed line denotes the starting year for projections. Black lines to the left of this line represent observation error trajectories as randomly generated from SPiCT parameters (with uncertainty). Black lines after the start of projections represent errors generated with the normal error model described in the text. The horizontal red dashed line represents no error.