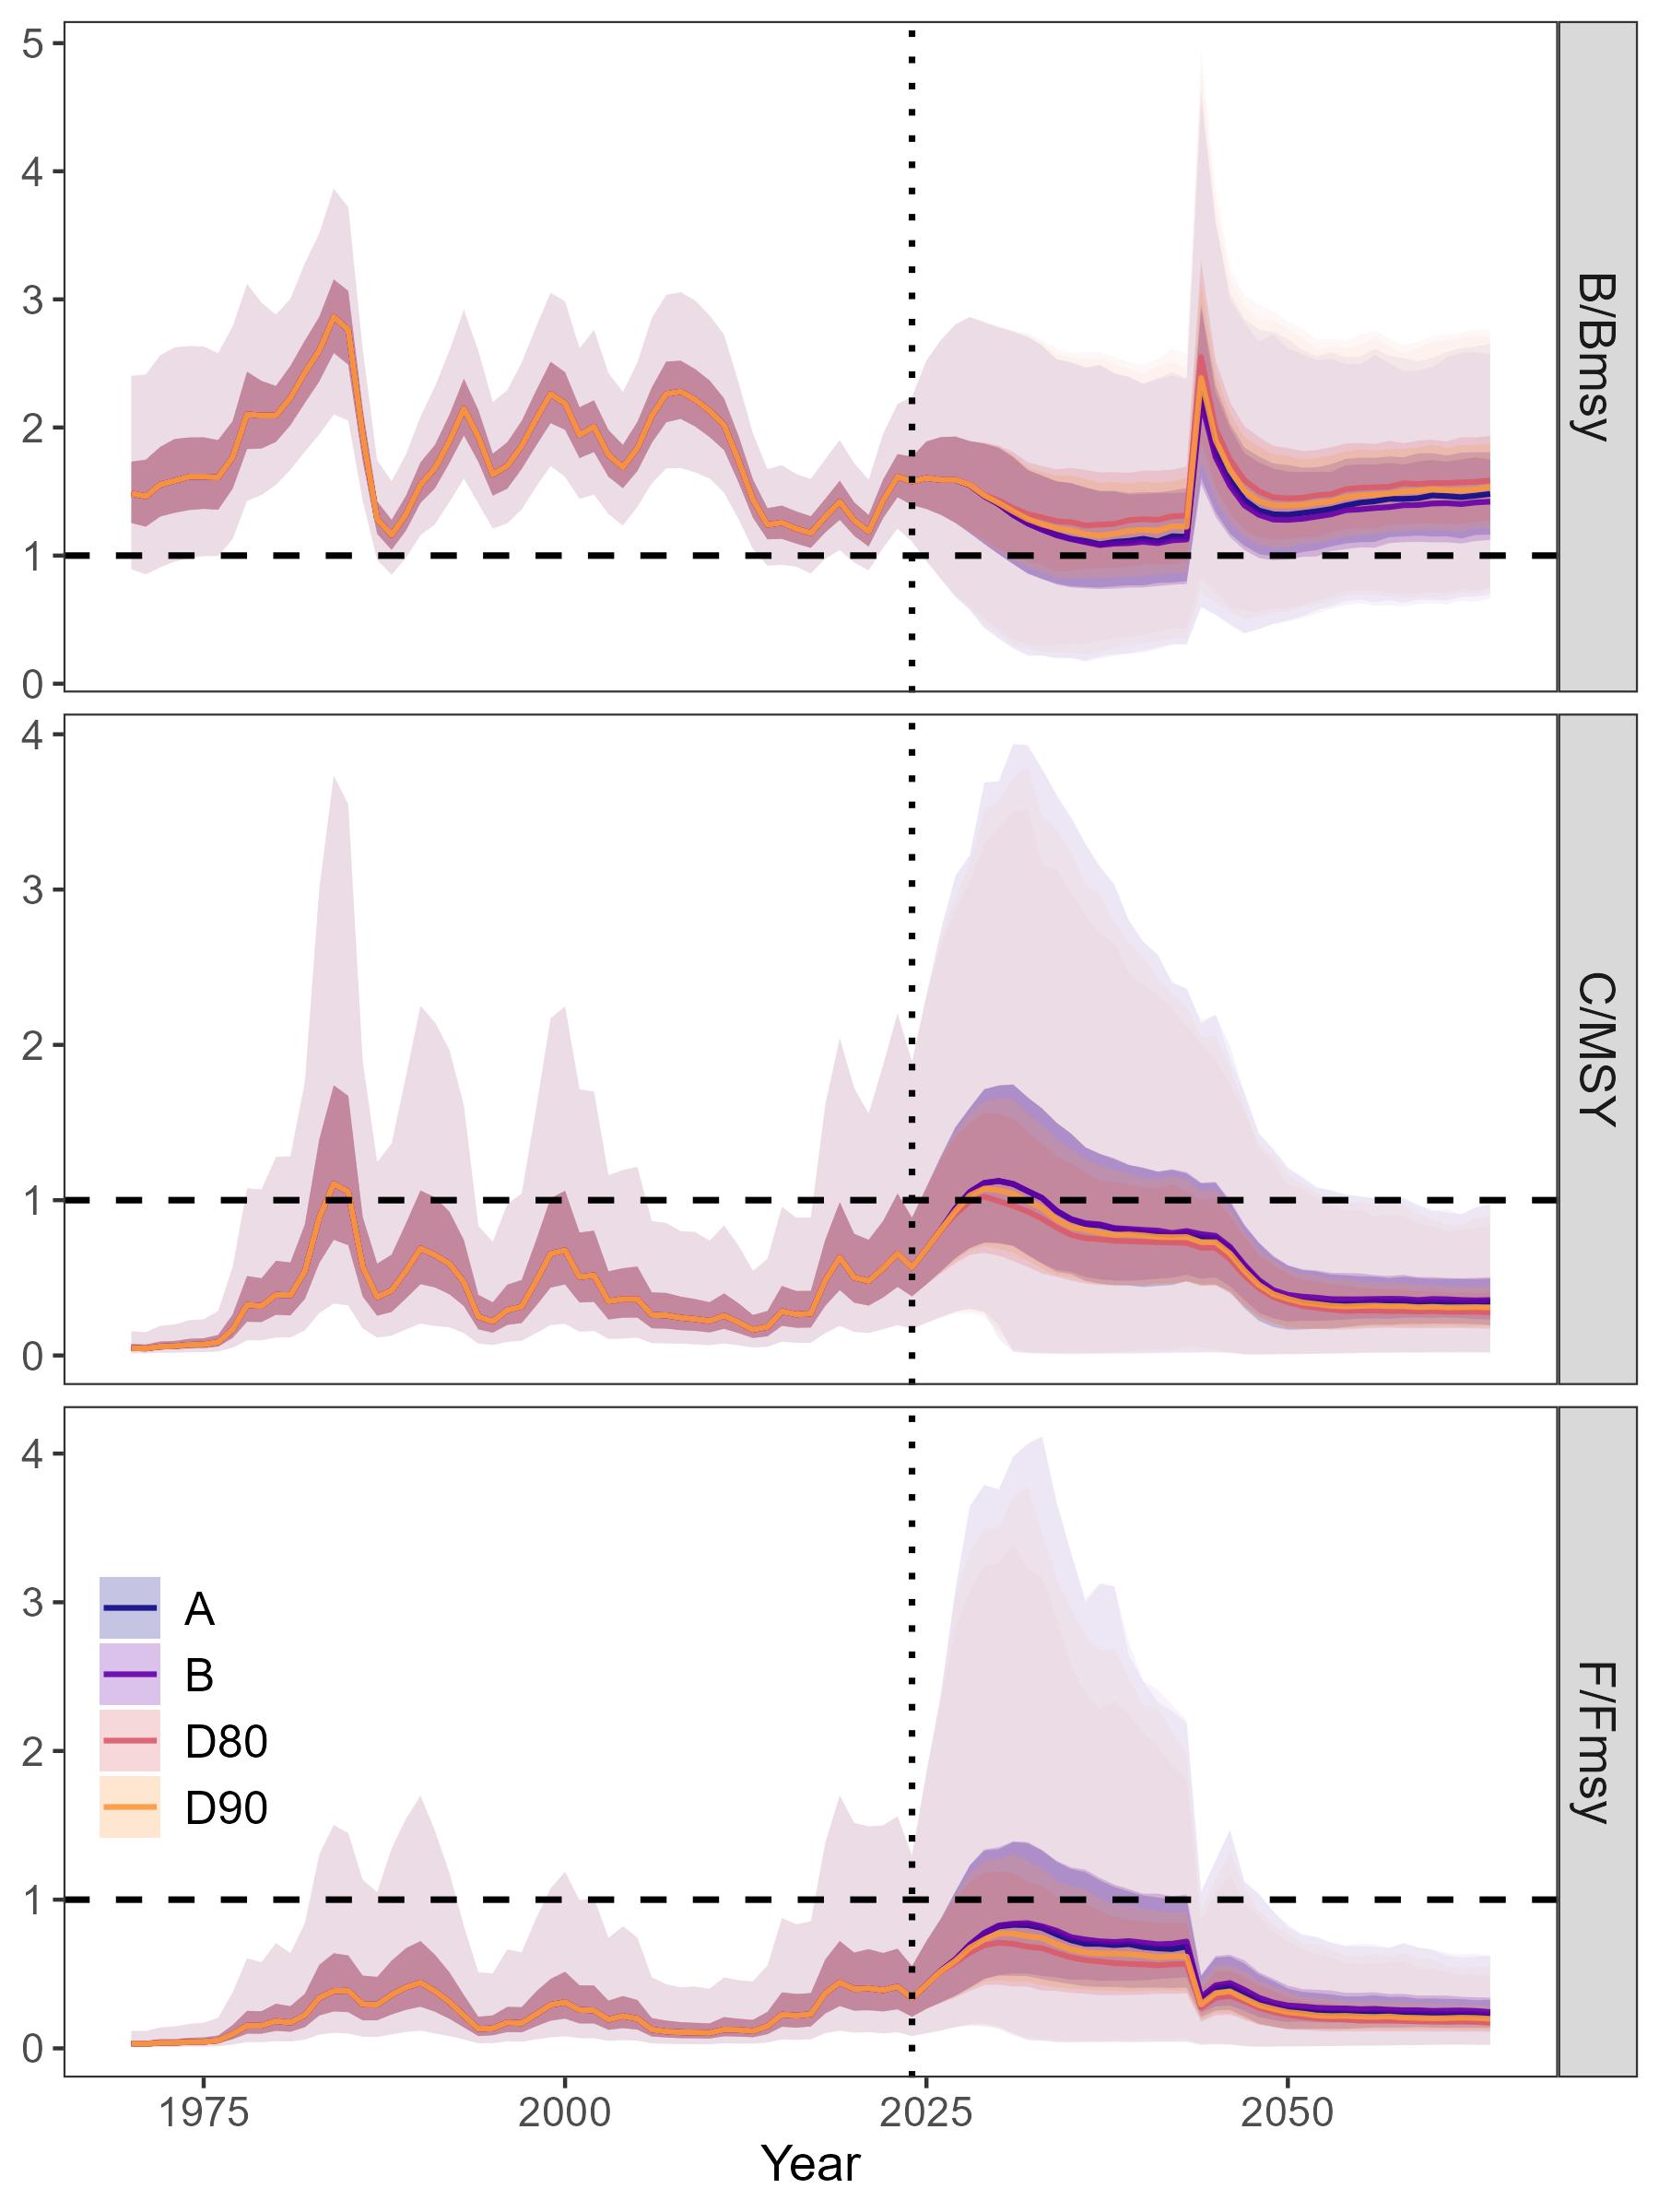
Figure 12: Relative biomass, catch, and fishing biomass projections under OM2 (shift-like reduction in carrying capacity in 2044) for the precautionary HCRs determined from OM1. The shaded areas show the inner 50th and 95th quantiles. Distributions of the metrics are computed over 1990 iterations.