Gå til hovedinnhold
Havforskningsinstituttet
HI
English
<- Tilbake
Søk
Søk
Søk
View page in English
Figur
Fra rapporten:
Nasjonalt tilsynsprogram for produksjon av skjell og andre bløtdyr – prøver analysert i 2023 for kjemiske forurensende stoffer og mikroorganismer
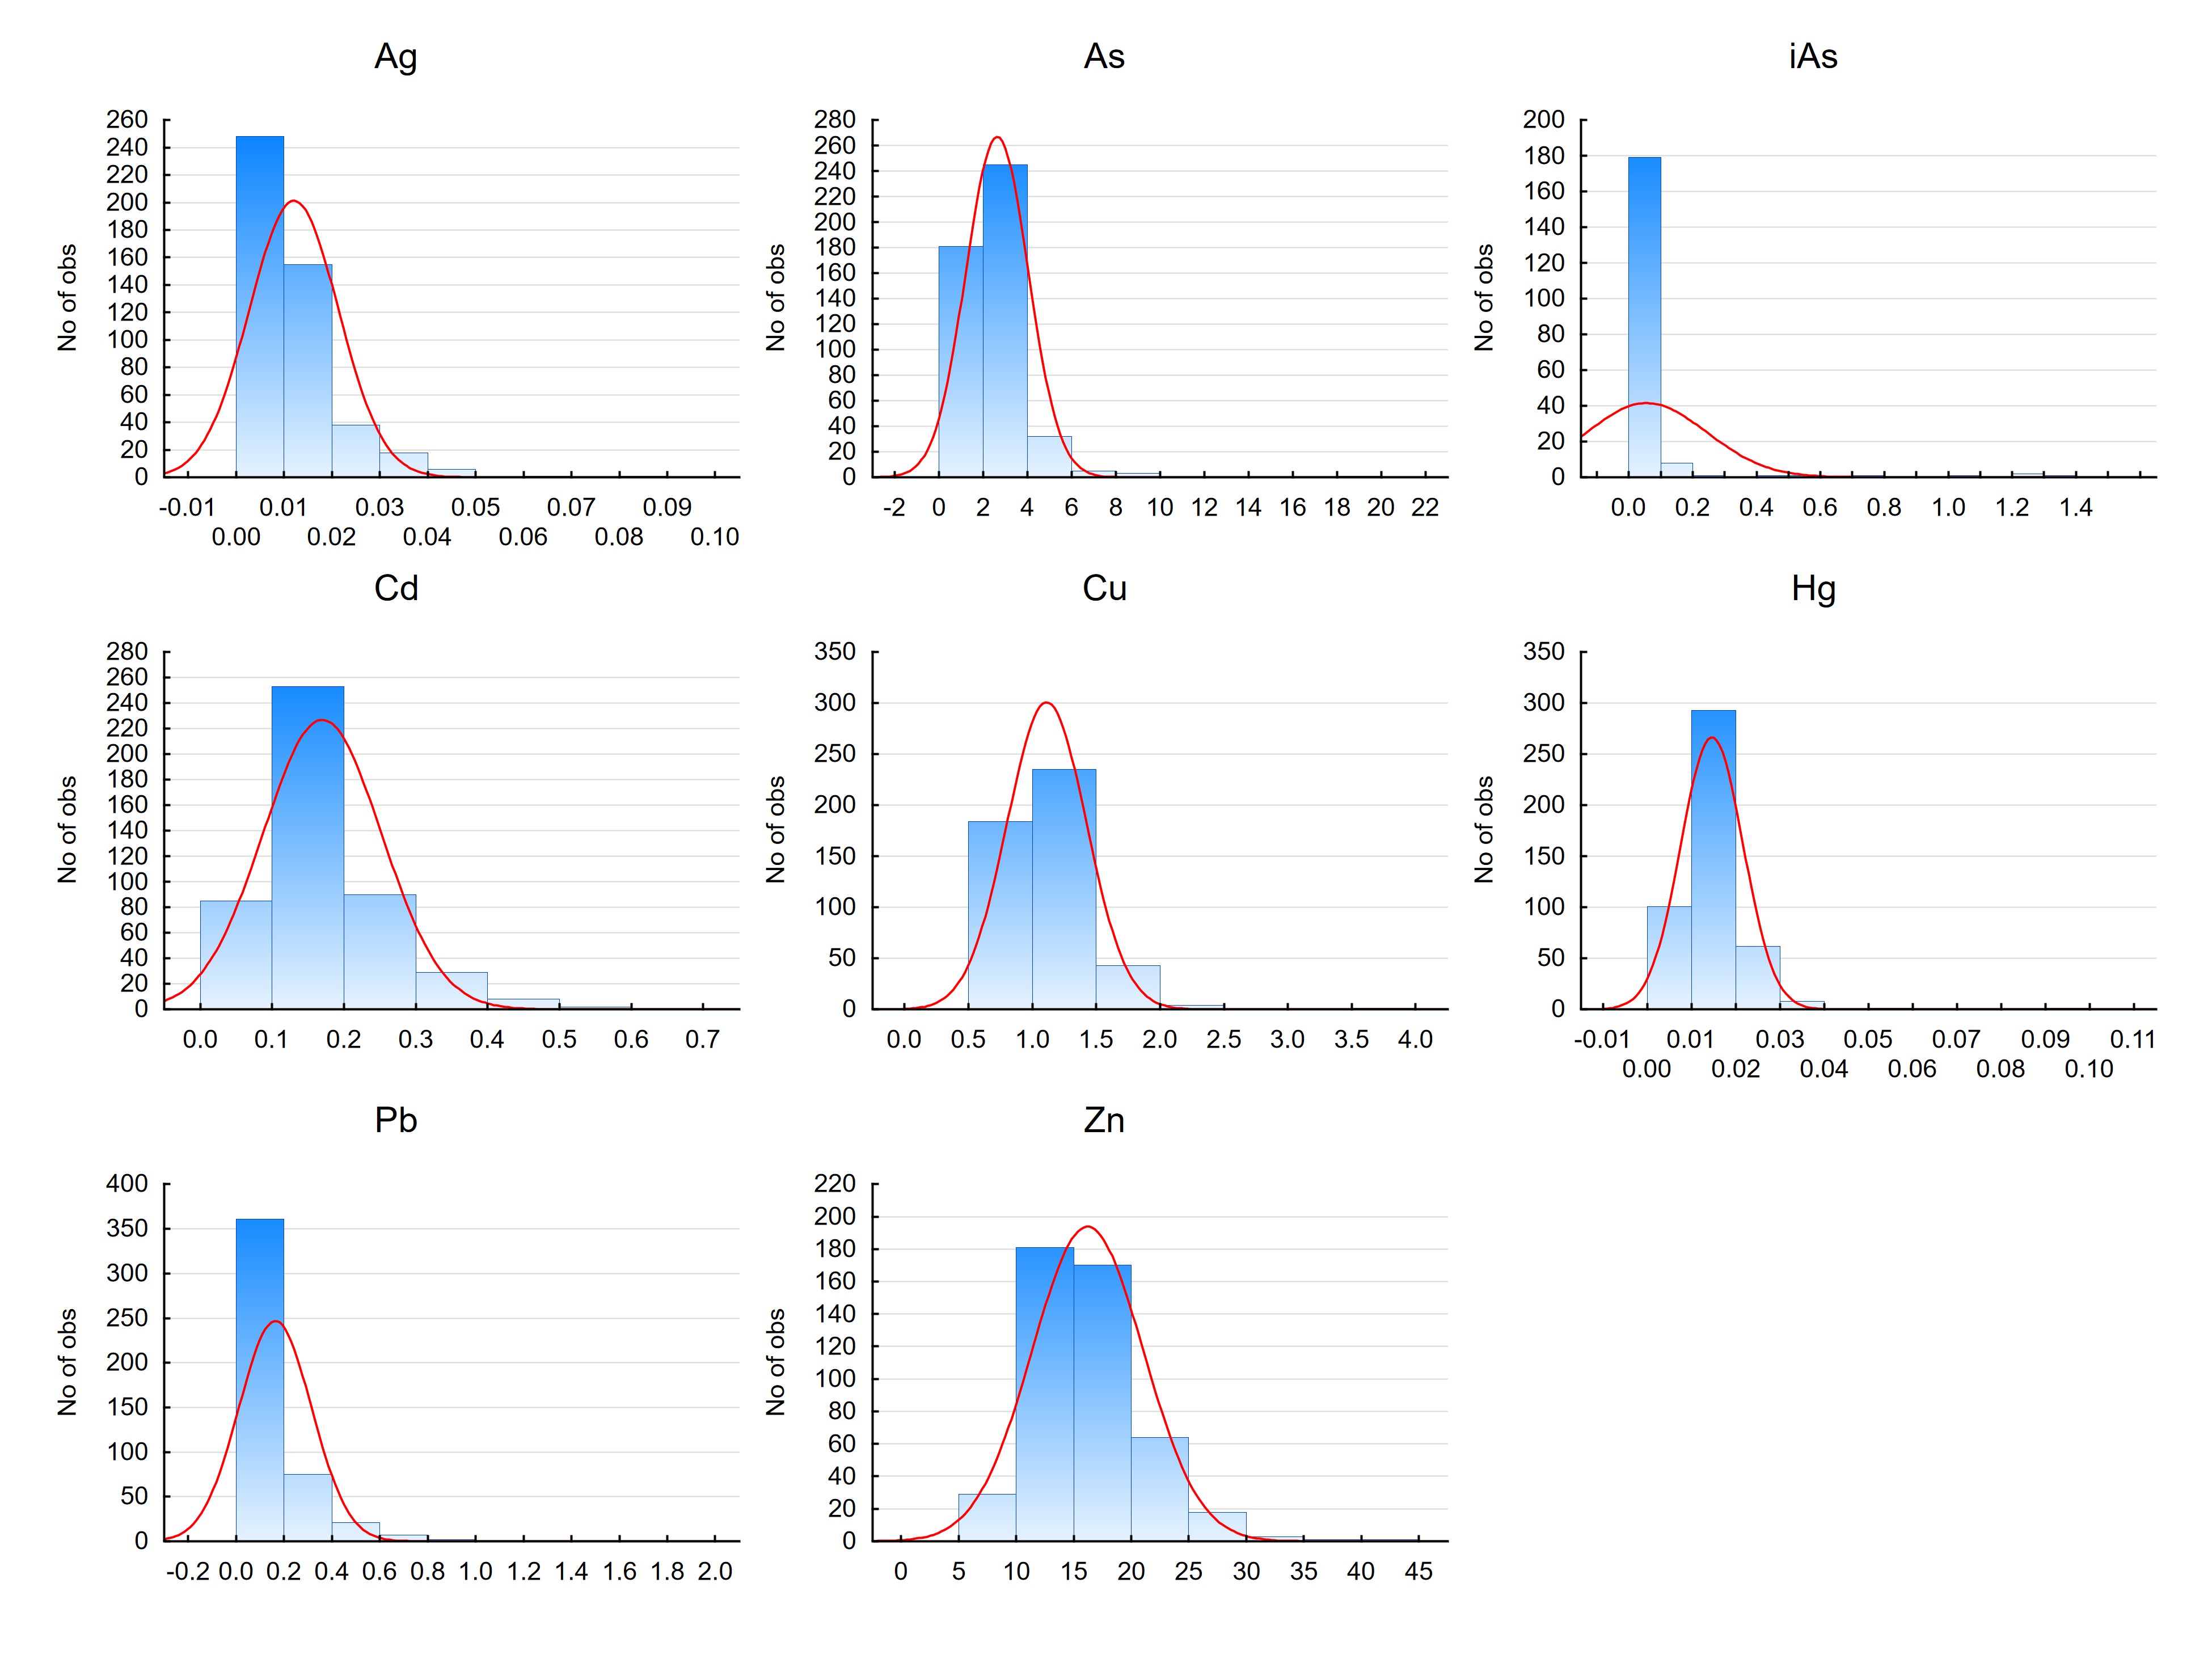
Figur 1. Histograms showing the distribution of metal concentrations in mussels (Mytilus edulis) from the shellfish monitoring program between 2005 and 2014. All concentrations are given as mg/kg wet weight.