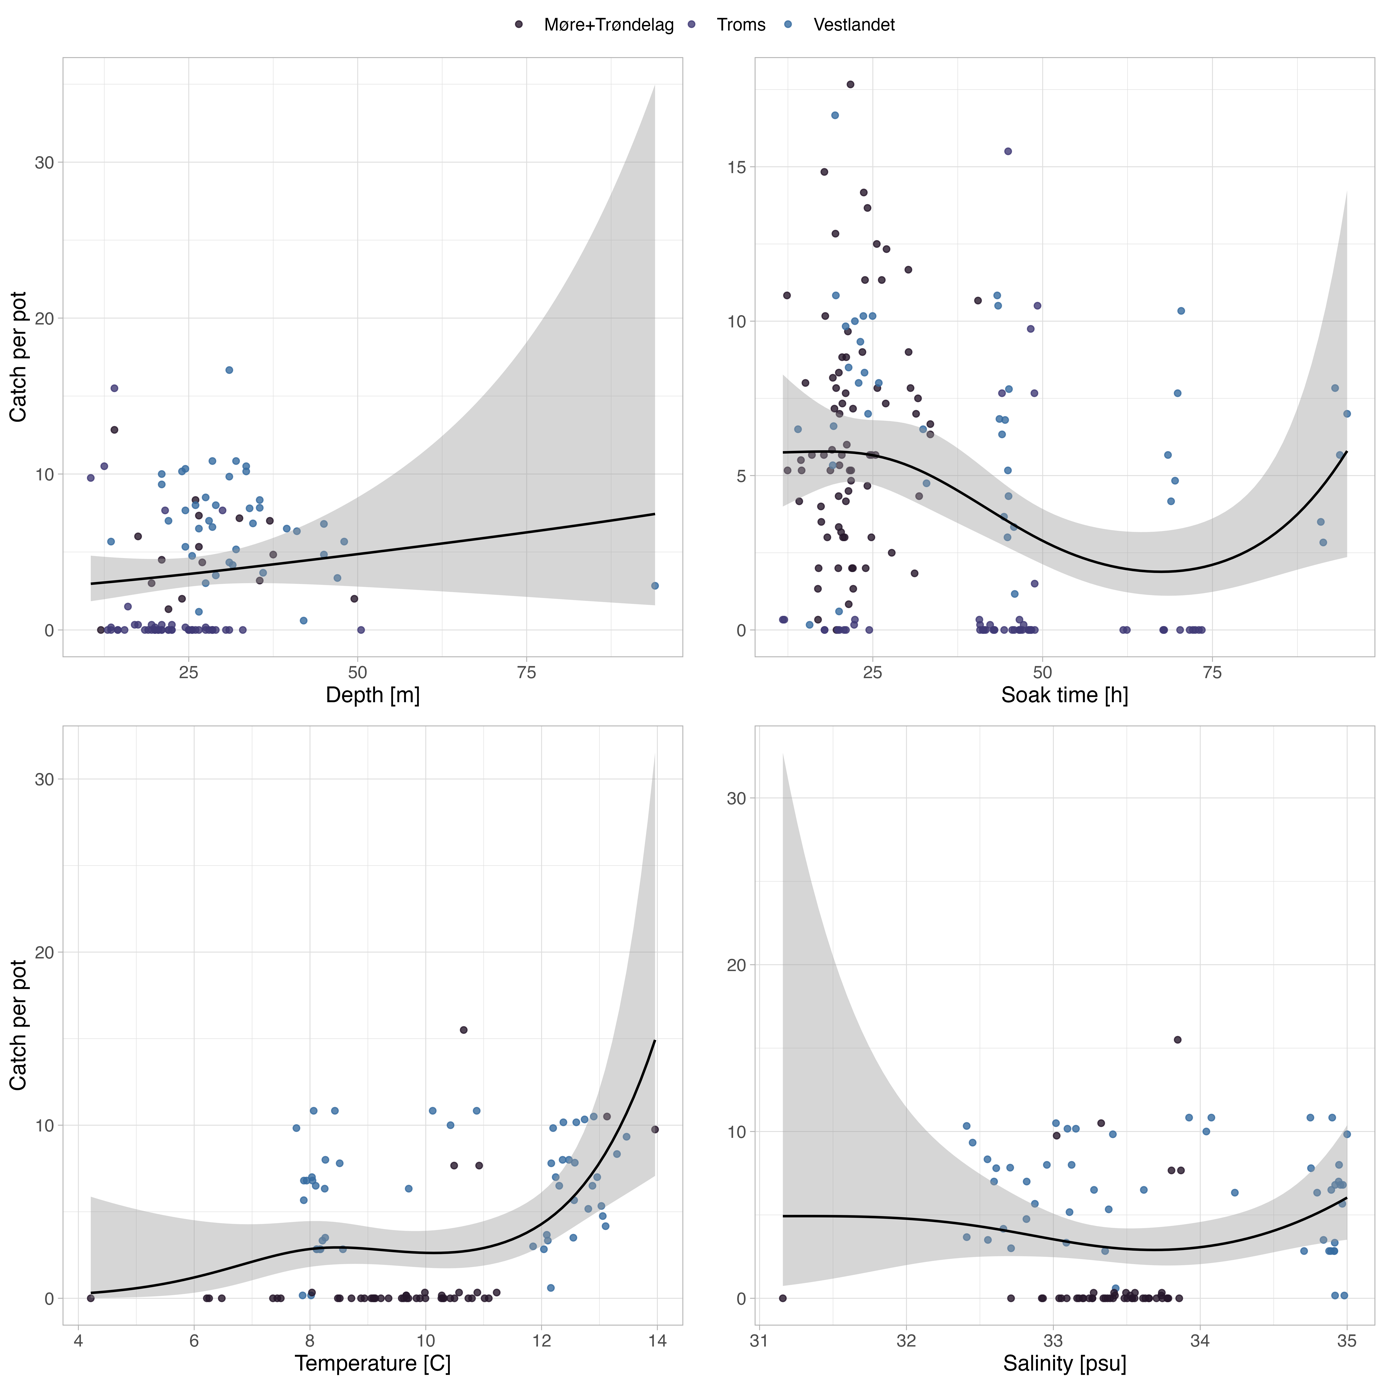
Figure 8: Average number of brown crab (Cancer pagurus) per pot in each station in relation to depth, soak time and bottom temperature and salinity. The different surveys and regions are separated by colours. The black line and the grey area represent the mean and 95 % confidence interval, respectively. The line is generated by the stat_smooth function in ggplot, with a generalized additive mixed model y~s(x, k= 4) and a tweedie error distribution. Temperature and salinity were measured near the bottom at the same location as the pot lines with a CTD.