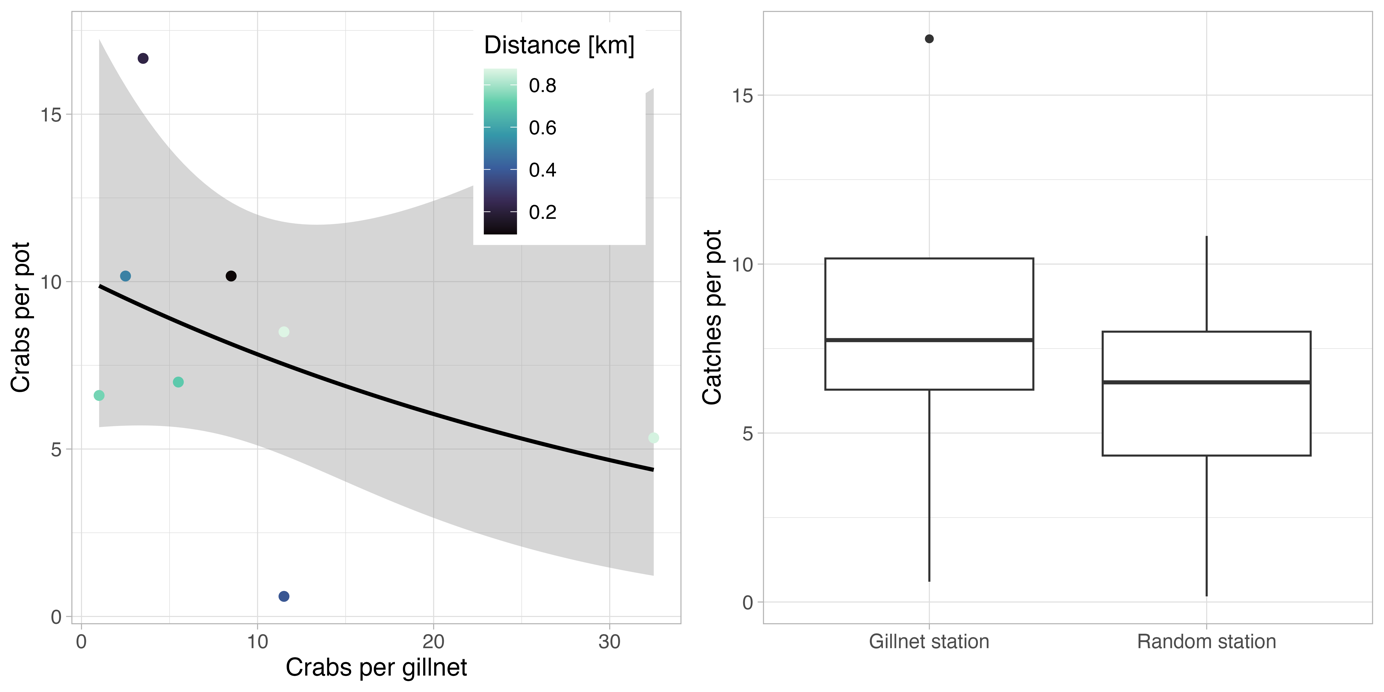
Figure 12: Relationship between crab catches per pot and gillnet at the stations closest to each other (left) and crab catch rates at pot stations close to where gillnets were set (“Gillnet station”) or at randomized positions (“Random station”) (right).