Gå til hovedinnhold
Havforskningsinstituttet
HI
English
<- Tilbake
Søk
Søk
Søk
View page in English
Figur
Fra rapporten:
Shellfish survey Vestlandet 2023
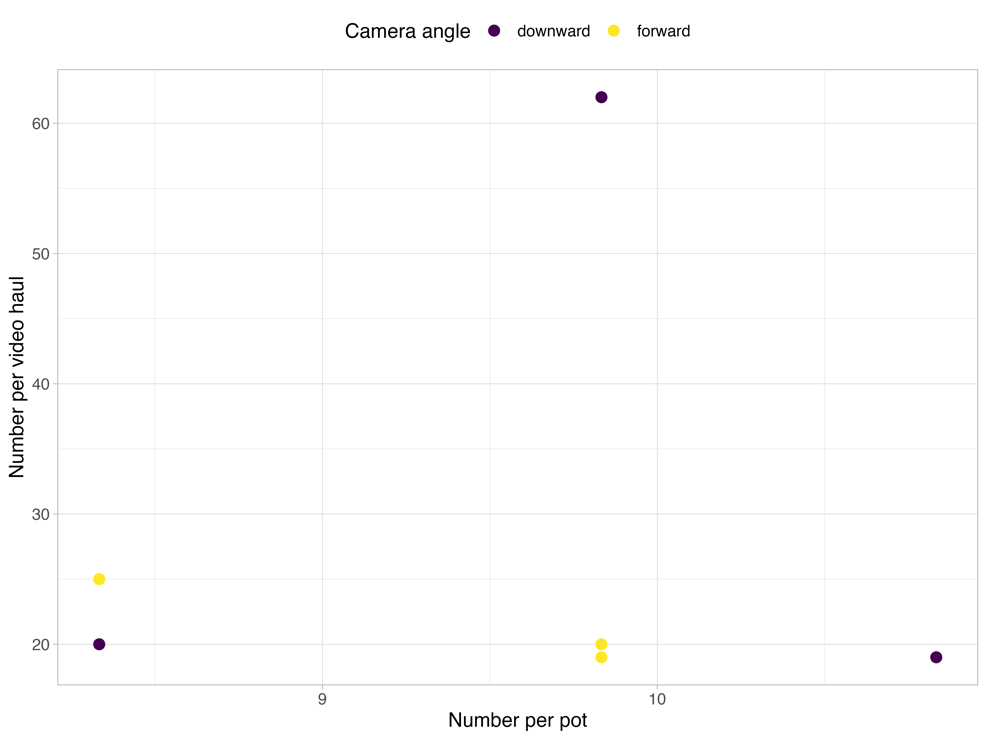
Figure 16: Comparing number of Nephrops per pot to each adjacent video stations, to evaluate/estimate gear coefficient.