Stock Name: Northeast Arctic cod (ICES areas 1 and 2)
Advice on fishing opportunities
The Joint Russian-Norwegian Arctic Fisheries Working Group (JRN-AFWG) advises that when the Joint Norwegian–Russian Fisheries Commission management plan is applied, catches in 2025 should be no more than 311 587 tonnes.
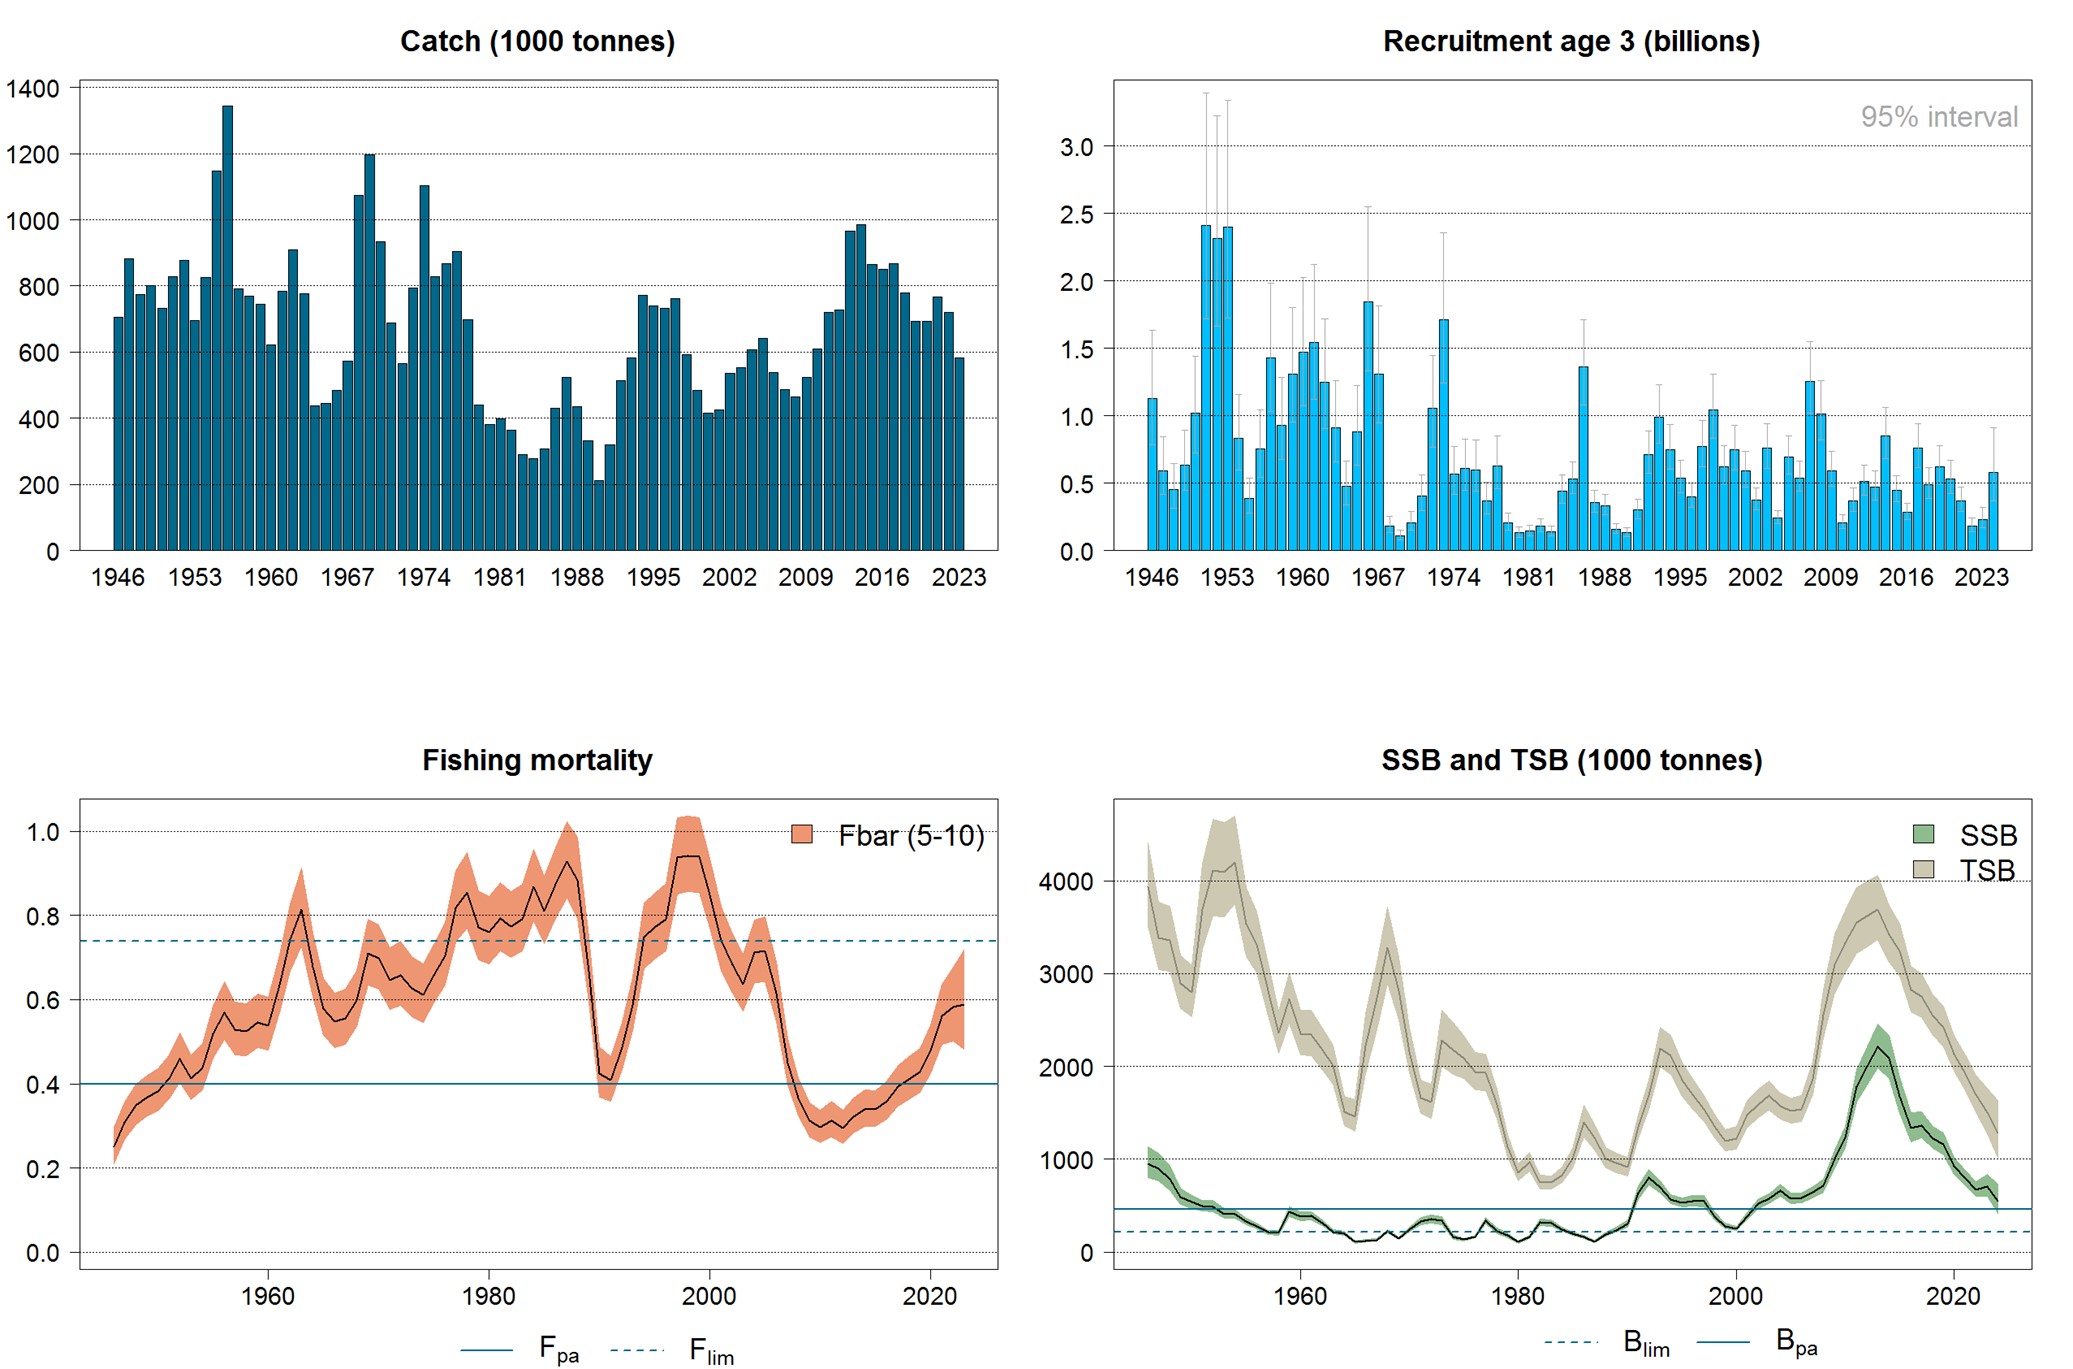
Stock development over time
Fishing pressure on the stock is above Fpa and below Flim and within the Fmgt range. The spawning-stock biomass is currently above MSY Btrigger, Bpa and Blim.
Catch scenarios
| Variable | Value | Notes |
|---|---|---|
| F ages 5–10 (2024) | 0.589 | Fsq =F2023. From assessment |
| SSB (2025) | 450 572 | From assessment |
| R age 3 (2024) | 587 000 | From recruitment model |
| R age 3 (2025) | 450 000 | From recruitment model |
| R age 3 (2026) | 375 000 | From recruitment model |
| R age 3 (2027) | 340 000 | From recruitment model |
| Total catch (2024) | 477 185 | Corresponding to Fsq |
| Basis | Total catch (2025) | F (2025) | SSB (2026) | % SSB change * | % TAC change ** | % Advice change *** |
|---|---|---|---|---|---|---|
| Management plan^ | 311 587 | 0.43 | 410 740 | -9 | -31 | -31 |
| Other options | ||||||
| FMSY **** | 292 245 | 0.40 | 425 617 | -6 | -36 | -36 |
| F = 0 | 0 | 0 | 664 770 | 48 | -100 | -100 |
| F = F2023 | 395 821 | 0.589 | 347 651 | -23 | -13 | -13 |
| Fpa | 292 245 | 0.40 | 425 617 | -6 | -36 | -36 |
| Flim | 466 835 | 0.74 | 296 859 | -34 | 3 | 3 |
* SSB 2026 relative to SSB 2025.
** Advice for 2025 relative to TAC for 2024 (453 427 tonnes).
*** Advice for 2025 relative to advice for 2024.
**** F = 0.40 corresponds to the lower bound of the FMSY range (0.40-0.60), F not reduced for SSB being below Bpa .
^ Since SSB in 2025 is below Bpa = 460 000 t, F = 0.40*SSB(2025)/Bpa = 0.3918 is used in the 3-year prediction, giving catches of 287 330, 309 101 and 338 329 tonnes in 2025, 2026 and 2027, respectively. The average of this is 311 587 tonnes. As SSB is below B pa in 2025, the 20% limit on annual change in TAC does not apply.
The advice for 2025 is 31% lower than the advice for 2024. The downward adjustment of stock size since last year’s assessment and the declining stock trend both contribute to the reduction in advice. In addition, the 20% TAC change constraint (Table 3) was applied in the advice for 2024, resulting in higher advice than that resulting from the target F (Ftr ). The stability constraint does not apply for 2025 because SSB has dropped below Bpa, and therefore advice for 2025 corresponds to target F (Ftr ), and is considerably lower than the advice for 2024.
Basis of the advice
| Advice basis | Joint Norwegian-Russian Fisheries Commission management plan |
|---|---|
| Management plan | At the 46th meeting of the Joint Norwegian-Russian Fisheries Commission (JNRFC) in October 2016, the previously used management plan was amended, and the current plan is as follows: The TAC is calculated as the average catch predicted for the coming 3 years, using the target level of exploitation (Ftr). The target level of exploitation is calculated according to the spawning-stock biomass (SSB) in the first year of the forecast as follows: - if SSB < Bpa , then Ftr = SSB / Bpa × FMSY ; - if Bpa ≤ SSB ≤ 2×Bpa , then Ftr = FMSY ; - if 2 × B pa < SSB < 3 × Bpa , then Ftr = FMSY × (1 + 0.5 × (SSB – 2 × Bpa ) / Bpa ); - if SSB ≥ 3 × Bpa , then Ftr = 1.5 × FMSY ; where FMSY = 0.40 and Bpa = 460 000 tonnes. If the spawning-stock biomass in the present year, the previous year, and each of the three years of prediction is above Bpa, the TAC should not be changed by more than ±20% compared with the previous year’s TAC. In this case, Ftr should however not be below 0.30. In 2014, JNRFC decided that from 2015 onwards, Norway and Russia can transfer to or borrow from the following year up to 10% of the country's quota. In 2021, this was increased to 15% as an extraordinary measure for transfers between 2021 and 2022 only. ICES evaluated this harvest control rule in 2016 (ICES, 2016) and 2021 (ICES, 2021) and concluded that it is precautionary. |
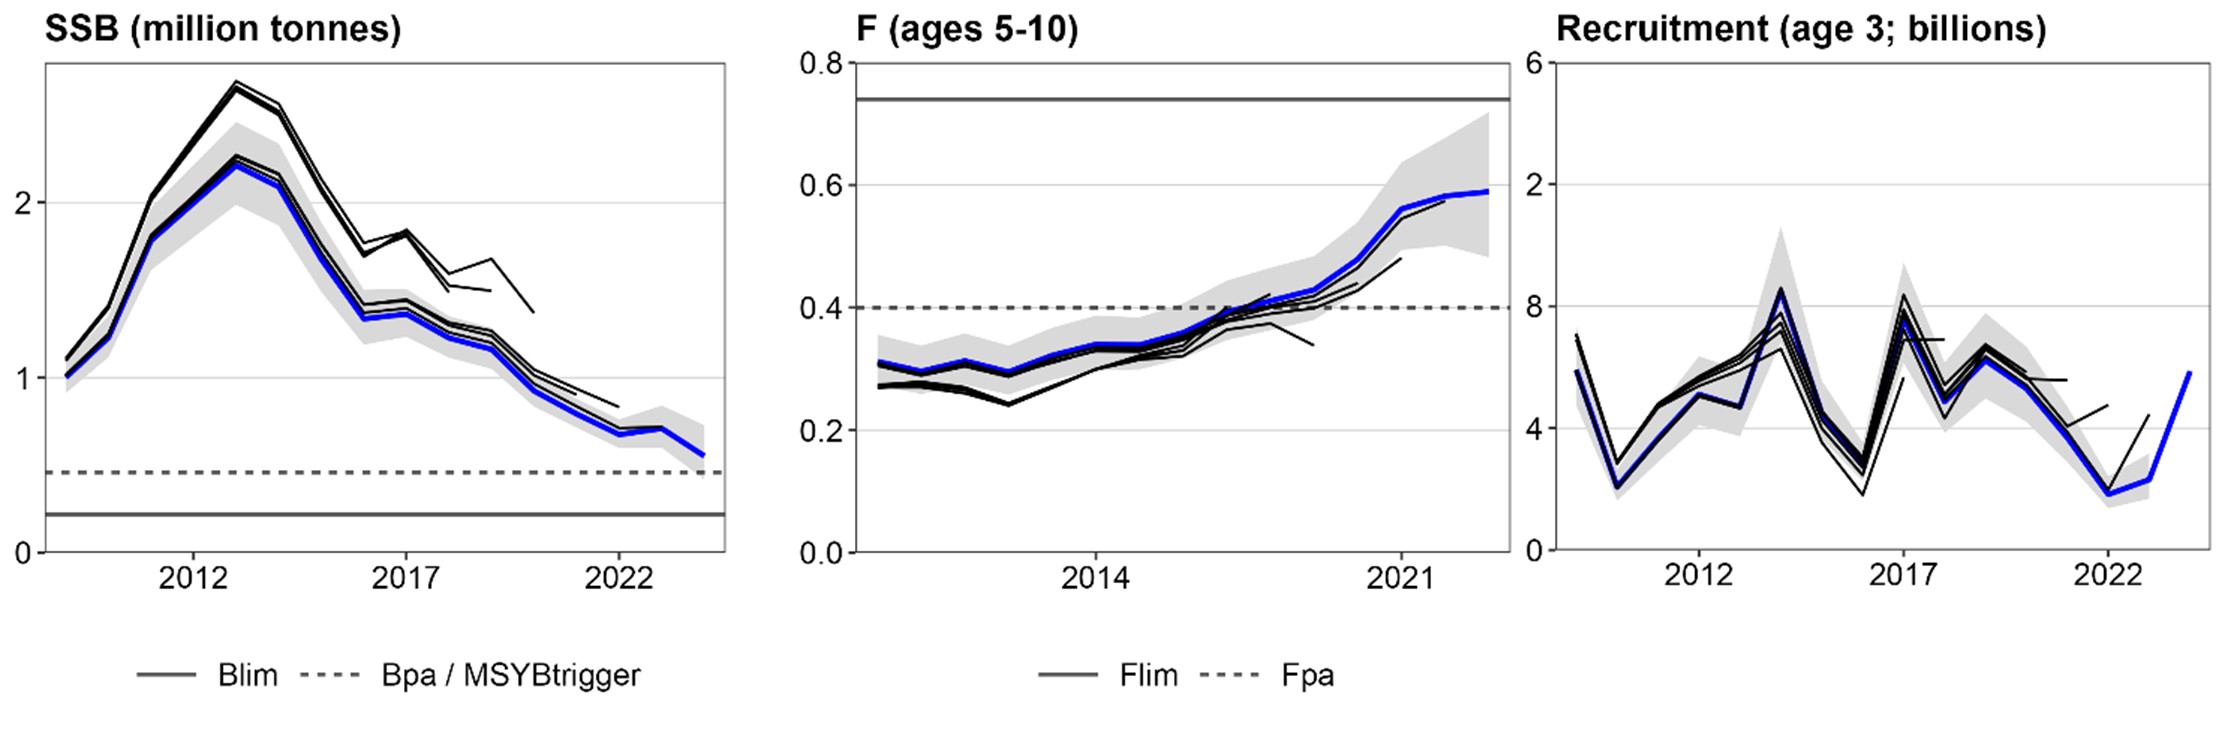
Quality of the assessment
After the 2021 benchmark, the assessment has been relatively consistent from year to year. Recruitment predictions in recent years have been overestimates.
Issues relevant for the advice
Due to the temporary suspension of Russian scientists from ICES, this assessment was as in 2022 and 2023 conducted by a Joint Russian-Norwegian Arctic Fisheries Working Group (JRN-AFWG) consisting of scientists from VNIRO (Russia) and IMR (Norway) (Howell et al., 2024).
This advice has been conducted outside ICES and should not be considered as ICES advice. However, this assessment and advice has been produced following the methodology agreed at the ICES benchmark in 2021 (ICES, 2021).
Fisheries targeting Northeast Arctic (NEA) cod take as bycatch a considerable part of the total golden redfish ( Sebastes norvegicus) catch, and the bycatch of the latter species is still above any sustainable catch level. Bycatch of golden redfish should be kept as low as possible. Bycatch of coastal cod should be kept as low as possible in order to avoid overfishing of the coastal cod (Gadus morhua) stocks (ICES, 2024).
The model for predicting recruitment has been revised. The new model only uses survey data, and environmental data are no longer used (Howell et al., 2024). Estimated recruitment has been below the long-term average since the 2014 year class.
The predictions for 2025 and following years indicate that SSB will be below Bpa and that catches and total stock biomass will increase slightly after 2025, while SSB will reach its lowest level in 2027 and then increase slightly.
In recent years stock size has been overestimated (particularly before the 2021 benchmark) and the stock is declining due to recruitment being below average. In this situation, the 20% limit on annual TAC change has led to fishing pressure well above the target in the HCR for several years. The SSB has now fallen below Bpa, and to continue to apply the stability constraint would no longer be precautionary. The allowed 10% quota transfer between years compounds this issue in the current situation with the spawning stock declining below Bpa.
Reference points
| Framework | Reference point | Value | Technical basis | Source |
|---|---|---|---|---|
| MSY approach | MSY Btrigger | 460 000 t | Bpa , and trigger point in HCR | ICES (2003, 2021) |
| FMSY range | 0.40 – 0.60 | Long-term simulations | ICES (2003, 2021) | |
| Precautionary approach | Blim | 220 000 t | Change point regression | ICES (2003, 2021) |
| Bpa | 460 000 t | The lowest SSB estimate having >90% probability of remaining above B lim | ICES (2003, 2021) | |
| Flim | 0.74 | F corresponding to an equilibrium stock = B lim | ICES (2003, 2021) | |
| Fpa | 0.40 | The highest F estimate having >90% probability of remaining below F lim | ICES (2003, 2021) | |
| Management plan | SSBmgt | 460 000 t | Two-step (double hockey-stick) HCR, see Table 3 | ICES (2017) |
| Fmgt | 0.40 – 0.60 | Two-step (double hockey-stick) HCR, see Table 3 | ICES (2017) |
Basis of the assessment
| ICES stock data category | 1 |
|---|---|
| Assessment type | Age-based analytical assessment (SAM) that uses catches in the model and in the forecast. |
| Input data | Commercial catches (international landings, ages and length frequencies from catch sampling); four survey indices (Joint bottom trawl survey Barents Sea, Jan–Mar; Joint acoustic survey Barents Sea and Lofoten, Feb–Mar; Russian bottom trawl survey, October–December; Joint Ecosystem survey); annual maturity data from the four surveys; natural mortalities from annual stomach sampling. |
| Discards and bycatch | Discarding is considered negligible in recent years (below 5%). Bycatch is included. |
| Indicators | None. |
| Other information | The methodology of assessment adopted by the last ICES benchmark for the stock in February 2021 (ICES, 2021) was followed, except for the recruitment predictions. |
| Working group | Joint Russian-Norwegian Arctic Fisheries Working Group (JRN-AFWG). |
History of the advice, catch, and management
| Year | ICES advice | Catch corresponding to advice | Agreed TAC | Official catches | Unreported landings (included in ICES catches) | ICES catches |
|---|---|---|---|---|---|---|
| 1987 | Gradual reduction in F | 595000 | 560000 | 552000 | 523071 | |
| 1988 | F = 0.51; TAC (Advice November 1987, revised advice May 1988) | 530000 (320000–360000) | 590000 (451000) | 459000 | 434939 | |
| 1989 | Large reduction in F | 335000 | 300000 | 348000 | 332481 | |
| 1990 | F at Flow; TAC | 172000 | 160000 | 210000 | 25000 | 212000 |
| 1991 | F at Flow; TAC | 215000 | 215000 | 294000 | 50000 | 319158 |
| 1992 | Within safe biological limits | 250000 | 356000 | 421000 | 130000 | 513234 |
| 1993 | Healthy stock | 256000 | 500000 | 575000 | 50000 | 581611 |
| 1994 | No long-term gains in increased F | 649000 | 700000 | 795000 | 25000 | 771086 |
| 1995 | No long-term gains in increased F | 681000 | 700000 | 763000 | 739999 | |
| 1996 | No long-term gains in increased F | 746000 | 700000 | 759000 | 732228 | |
| 1997 | Well below Fmed | < 993000 | 850000 | 792000 | 762403 | |
| 1998 | F less than Fmed | 514000 | 654000 | 615000 | 592624 | |
| 1999 | Reduce F to below Fpa | 360000 | 480000 | 506000 | 484910 | |
| 2000 | Increase B above Bpa in 2001 | 110000 | 390000 | 414870 | ||
| 2001 | High probability of SSB> Bpa in 2003 | 263000 | 395000 | 426471 | ||
| 2002 | Reduce F to well below 0.25 | 181000 | 395000 | 90000 | 535045 | |
| 2003 | Reduce F to below Fpa | 305000 | 395000 | 115000 | 551990 | |
| 2004 | Reduce F to below Fpa | 398000 | 486000 | 117000 | 606445 | |
| 2005 | Take into account coastal cod and redfish bycatches. Apply catch rule. | 485000 | 485000 | 166000 | 641276 | |
| 2006 | Take into account coastal cod and redfish bycatches. Apply amended catch rule. | 471000 | 471000 | 67100 | 537642 | |
| 2007 | Take into account coastal cod and redfish bycatches. Fpa | 309000 | 424000 | 41087 | 486883 | |
| 2008 | Take into account coastal cod and redfish bycatches. Apply catch rule. | 409000 | 430000 | 15000 | 464171 | |
| 2009 | Take into account coastal cod and redfish bycatches. Apply catch rule. | 473000 | 525000 | 0 | 523431 | |
| 2010 | Take into account coastal cod and redfish bycatches. Apply catch rule. | 577500 | 607000 | 0 | 609983 | |
| 2011 | Take into account coastal cod and redfish bycatches. Apply catch rule. | 703000 | 703000 | 0 | 719829 | |
| 2012 | Take into account coastal cod and redfish bycatches. Apply catch rule. | 751000 | 751000 | 0 | 727663 | |
| 2013 | Take into account coastal cod and S. marinus ^^ bycatches. Apply catch rule. | 940000 | 1000000 | 0 | 966209 | |
| 2014 | Take into account coastal cod and S. marinus^^ bycatches. Apply catch rule. | 993000 | 993000 | 0 | 986449 | |
| 2015 | Take into account coastal cod and S. norvegicus bycatches. Apply catch rule. | 894000 | 894000 | 0 | 864384 | |
| 2016 | Take into account coastal cod and S. norvegicus bycatches. Apply catch rule. | 805000 | 894000 | 0 | 849422 | |
| 2017 | Take into account coastal cod and S. norvegicus bycatches. Apply management plan. | ≤ 805000 | 890000 ^ | 0 | 868276 | |
| 2018 | Take into account coastal cod and S. norvegicus bycatches. Apply management plan. | 712000 | 775000 | 0 | 778627 | |
| 2019 | Take into account coastal cod and S. norvegicus bycatches. Apply management plan. | 674678 | 725000 | 0 | 692609 | |
| 2020 | Apply management plan | ≤ 689672 | 738000 | 0 | 692903 | |
| 2021 | Apply management plan | ≤ 885600 | 885600 | 0 | 767284^^^ | |
| 2022 | Apply management plan | ≤ 708480 | 708480 | 0 | 719211^^^ | |
| 2023 | Apply management plan^^^ | ≤ 566784 | 566784 | 0 | 582552^^^ | |
| 2024 | Apply management plan^^^ | ≤ 453427 | 453427 | |||
| 2025 | Apply management plan^^^ | ≤ 311587 |
^ The 2017 TAC was set according to the management plan agreed by JNRFC in October 2016.
^^ Until 2014 this species was named Sebastes marinus , thereafter Sebastes norvegicus.
^^^ In 2022-2024 assessment and advice was carried out by the Joint Russian-Norwegian Arctic Fisheries working group (JRN-AFWG) which compiled catches for 2021-2023 and gave advice for 2023-2025.
History of catch and landings
| Year | Faroe Islands | France | German Dem.Rep. | Fed.Rep. Germany | Greenland | Iceland | Norway | Poland | United Kingdom | Russia** | Spain | Others | Total | |
|---|---|---|---|---|---|---|---|---|---|---|---|---|---|---|
| 1961 | 3934 | 13755 | 3921 | 8129 | 268377 | - | 158113 | 325780 | 1212 | 783221 | ||||
| 1962 | 3109 | 20482 | 1532 | 6503 | 225615 | - | 175020 | 476760 | 245 | 909266 | ||||
| 1963 | - | 18318 | 129 | 4223 | 205056 | 108 | 129779 | 417964 | - | 775577 | ||||
| 1964 | - | 8634 | 297 | 3202 | 149878 | - | 94549 | 180550 | 585 | 437695 | ||||
| 1965 | - | 526 | 91 | 3670 | 197085 | - | 89962 | 152780 | 816 | 444930 | ||||
| 1966 | - | 2967 | 228 | 4284 | 203792 | - | 103012 | 169300 | 121 | 483704 | ||||
| 1967 | - | 664 | 45 | 3632 | 218910 | - | 87008 | 262340 | 6 | 572605 | ||||
| 1968 | - | - | 225 | 1073 | 255611 | - | 140387 | 676758 | - | 1074084 | ||||
| 1969 | 29374 | - | 5907 | 5543 | 305241 | 7856 | 231066 | 612215 | 133 | 1197226 | ||||
| 1970 | 26265 | 44245 | 12413 | 9451 | 377606 | 5153 | 181481 | 276632 | - | 933246 | ||||
| 1971 | 5877 | 34772 | 4998 | 9726 | 407044 | 1512 | 80102 | 144802 | 215 | 689048 | ||||
| 1972 | 1393 | 8915 | 1300 | 3405 | 394181 | 892 | 58382 | 96653 | 166 | 565287 | ||||
| 1973 | 1916 | 17028 | 4684 | 16751 | 285184 | 843 | 78808 | 387196 | 276 | 792686 | ||||
| 1974 | 5717 | 46028 | 4860 | 78507 | 287276 | 9898 | 90894 | 540801 | 38453 | 1102434 | ||||
| 1975 | 11309 | 28734 | 9981 | 30037 | 277099 | 7435 | 101843 | 343580 | 19368 | 829377 | ||||
| 1976 | 11511 | 20941 | 8946 | 24369 | 344502 | 6986 | 89061 | 343057 | 18090 | 867463 | ||||
| 1977 | 9167 | 15414 | 3463 | 12763 | 388982 | 1084 | 86781 | 369876 | 17771 | 905301 | ||||
| 1978 | 9092 | 9394 | 3029 | 5434 | 363088 | 566 | 35449 | 267138 | 5525 | 698715 | ||||
| 1979 | 6320 | 3046 | 547 | 2513 | 294821 | 15 | 17991 | 105846 | 9439 | 440538 | ||||
| 1980 | 9981 | 1705 | 233 | 1921 | 232242 | 3 | 10366 | 115194 | 8789 | 380434 | ||||
| 1981 | 12825 | 3106 | 298 | 2228 | 277818 | 5262 | 83000 | 14500 | - | 399037 | ||||
| 1982 | 11998 | 761 | 302 | 1717 | 287525 | 6601 | 40311 | 14515 | - | 363730 | ||||
| 1983 | 11106 | 126 | 473 | 1243 | 234000 | 5840 | 22975 | 14229 | - | 289992 | ||||
| 1984 | 10674 | 11 | 686 | 1010 | 230743 | 3663 | 22256 | 8608 | - | 277651 | ||||
| 1985 | 13418 | 23 | 1019 | 4395 | 211065 | 3335 | 62489 | 7846 | 4330 | 307920 | ||||
| 1986 | 18667 | 591 | 1543 | 10092 | 232096 | 7581 | 150541 | 5497 | 3505 | 430113 | ||||
| 1987 | 15036 | 1 | 986 | 7035 | 268004 | 10957 | 202314 | 16223 | 2515 | 523071 | ||||
| 1988 | 15329 | 2551 | 605 | 2803 | 223412 | 8107 | 169365 | 10905 | 1862 | 434939 | ||||
| 1989 | 15625 | 3231 | 326 | 3291 | 158684 | 7056 | 134593 | 7802 | 1273 | 332481 | ||||
| 1990 | 9584 | 592 | 169 | 1437 | 88737 | 3412 | 74609 | 7950 | 510 | 187000 | ||||
| 1991 | 8981 | 975 | 2613 | 126226 | 3981 | 119427*** | 3677 | 3278 | 269158 | |||||
| 1992 | 11663 | 2 | 3911 | 3337 | 168460 | 6120 | 182315 | 6217 | 1209 | 383234 | ||||
| 1993 | 17435 | 3572 | 5887 | 5389 | 9374 | 221051 | 11336 | 244860 | 8800 | 3907 | 531611 | |||
| 1994 | 22826 | 1962 | 8283 | 6882 | 36737 | 318395 | 15579 | 291925 | 14929 | 28568 | 746086 | |||
| 1995 | 22262 | 4912 | 7428 | 7462 | 34214 | 319987 | 16329 | 296158 | 15505 | 15742 | 739999 | |||
| 1996 | 17758 | 5352 | 8326 | 6529 | 23005 | 319158 | 16061 | 305317 | 15871 | 14851 | 732228 | |||
| 1997 | 20076 | 5353 | 6680 | 6426 | 4200 | 357825 | 18066 | 313344 | 17130 | 13303 | 762403 | |||
| 1998 | 14290 | 1197 | 3841 | 6388 | 1423 | 284647 | 14294 | 244115 | 14212 | 8217 | 592624 | |||
| 1999 | 13700 | 2137 | 3019 | 4093 | 1985 | 223390 | 11315 | 210379 | 8994 | 5898 | 484910 | |||
| 2000 | 13350 | 2621 | 3513 | 5787 | 7562 | 192860 | 9165 | 166202 | 8695 | 5115 | 414870 | |||
| 2001 | 12500 | 2681 | 4524 | 5727 | 5917 | 188431 | 8698 | 183572 | 9196 | 5225 | 426471 | |||
| 2002 | 15693 | 2934 | 4517 | 6419 | 5975 | 202559 | 8977 | 184072 | 8414 | 5484 | 445045 | |||
| 2003 | 19427 | 2921 | 4732 | 7026 | 5963 | 191977 | 8711 | 182160 | 7924 | 6149 | 436990 | |||
| 2004 | 19226 | 3621 | 6187 | 8196 | 7201 | 212117 | 14004 | 201525 | 11285 | 6082 | 489445 | |||
| 2005 | 16273 | 3491 | 5848 | 8135 | 5874 | 207825 | 10744 | 200077 | 9349 | 7660 | 475276 | |||
| 2006 | 16327 | 4376 | 3837 | 8164 | 5972 | 201987 | 10594 | 203782 | 9219 | 6271 | 470527 | |||
| 2007 | 14788 | 3190 | 4619 | 5951 | 7316 | 199809 | 9298 | 186229 | 9496 | 5101 | 445796 | |||
| 2008 | 15812 | 3149 | 4955 | 5617 | 7535 | 196598 | 8287 | 190225 | 9658 | 7336 | 449171 | |||
| 2009 | 16905 | 3908 | 8585 | 4977 | 7380 | 224298 | 8632 | 229291 | 12013 | 7442 | 523431 | |||
| 2010 | 15977 | 4499 | 8442 | 6584 | 11299 | 264701 | 9091 | 267547 | 12657 | 9185 | 609983 | |||
| 2011 | 13429 | 1173 | 4621 | 7155 | 12734 | 331535 | 8210 | 310326 | 13291 | 17354^ | 719829 | |||
| 2012 | 17523 | 2841 | 8500 | 8520 | 9536 | 315739 | 11166 | 329943 | 12814 | 11081 | 727663 | |||
| 2013 | 13833 | 7858 | 8010 | 7885 | 14734 | 438734 | 12536 | 432314 | 15042 | 15263 | 966209 | |||
| 2014 | 33298 | 8149 | 6225 | 10864 | 18205 | 431846 | 14762 | 433479 | 16378 | 13243 | 986449 | |||
| 2015 | 26568 | 7480 | 6427 | 7055 | 16120 | 377983 | 11778 | 381778 | 19905 | 9880 | 864384 | |||
| 2016 | 24084 | 7946 | 6336 | 8607 | 16031 | 348949 | 13583 | 394107 | 14640 | 15139 | 849422 | |||
| 2017 | 28637 | 9554 | 5977 | 13638 | 11925 | 357419 | 16731 | 396180 | 14414 | 13802 | 868276 | |||
| 2018 | 26152 | 6605 | 9768 | 12743 | 10708 | 333539 | 11533 | 340364 | 13143 | 14071 | 778627 | |||
| 2019 | 22270 | 6371 | 8470 | 7553 | 12294 | 282120 | 11214 | 316813 | 13939 | 11565 | 692609 | |||
| 2020 | 21679 | 5796 | 9725 | 7391 | 9734 | 289472 | 12113 | 312683 | 11403 | 12908 | 692903 | |||
| 2021 | 21767 | 4459 | 6190 | 8246 | 8933 | 337931 | 5426 | 352064 | 11080 | 11188 | 767284^^ | |||
| 2022 | 21530 | 4988 | 7134 | 7688 | 6214 | 310145 | 7024 | 333697 | 12214 | 8577 | 719211^^ | |||
| 2023* | 17556 | 4632 | 5630 | 3994 | 5157 | 242117 | 5972 | 276923 | 8030 | 12539 | 582552^^ | |||
* Provisional figures.
** USSR prior to 1991.
*** Includes Baltic countries.
^ Includes unspecified EU catches.
^^ In 2022-2024 assessment and advice was carried out by the Joint Russian-Norwegian Arctic Fisheries working group (JRN-AFWG) which compiled catches for 2021-2023 and gave advice for 2023-2025.
Summary of the assessment
| Year | Recruitment | Spawning-stock biomass | Total catch | Fishing mortality | |||||||
|---|---|---|---|---|---|---|---|---|---|---|---|
| Recruitment (Age 3) | Low | High | SSB | Low | High | F (ages 5–10) | Low | High | |||
| thousands | Tonnes | tonnes | |||||||||
| 1946 | 1130233 | 782413 | 1632676 | 952985 | 800875 | 1133985 | 706000 | 0.25 | 0.21 | 0.297 | |
| 1947 | 591326 | 415003 | 842564 | 902641 | 766858 | 1062465 | 882017 | 0.309 | 0.268 | 0.357 | |
| 1948 | 451445 | 314708 | 647594 | 784654 | 662164 | 929804 | 774295 | 0.348 | 0.303 | 0.399 | |
| 1949 | 632170 | 446972 | 894103 | 594887 | 511210 | 692260 | 800122 | 0.369 | 0.323 | 0.421 | |
| 1950 | 1020622 | 724002 | 1438764 | 535869 | 471032 | 609630 | 731982 | 0.382 | 0.335 | 0.436 | |
| 1951 | 2411969 | 1715606 | 3390985 | 495077 | 440550 | 556353 | 827180 | 0.412 | 0.363 | 0.468 | |
| 1952 | 2316011 | 1661589 | 3228179 | 488765 | 431752 | 553306 | 876795 | 0.459 | 0.404 | 0.521 | |
| 1953 | 2400790 | 1726293 | 3338828 | 412395 | 362012 | 469790 | 695546 | 0.412 | 0.362 | 0.468 | |
| 1954 | 832049 | 598733 | 1156285 | 408300 | 361237 | 461494 | 826021 | 0.438 | 0.386 | 0.496 | |
| 1955 | 384305 | 276330 | 534471 | 327878 | 294448 | 365103 | 1147841 | 0.518 | 0.46 | 0.584 | |
| 1956 | 752521 | 542353 | 1044132 | 281174 | 253768 | 311540 | 1343068 | 0.57 | 0.505 | 0.642 | |
| 1957 | 1430781 | 1033581 | 1980624 | 212263 | 191141 | 235718 | 792557 | 0.528 | 0.468 | 0.594 | |
| 1958 | 929342 | 673739 | 1281916 | 205421 | 183124 | 230432 | 769313 | 0.526 | 0.467 | 0.591 | |
| 1959 | 1310632 | 953458 | 1801609 | 434410 | 385584 | 489419 | 744607 | 0.546 | 0.486 | 0.613 | |
| 1960 | 1473685 | 1071921 | 2026033 | 384829 | 339043 | 436798 | 622042 | 0.539 | 0.48 | 0.606 | |
| 1961 | 1541584 | 1120349 | 2121198 | 386500 | 343409 | 434997 | 783221 | 0.634 | 0.569 | 0.706 | |
| 1962 | 1249285 | 907074 | 1720602 | 315322 | 283702 | 350467 | 909266 | 0.743 | 0.667 | 0.827 | |
| 1963 | 909205 | 656361 | 1259451 | 215906 | 194672 | 239457 | 776337 | 0.815 | 0.728 | 0.913 | |
| 1964 | 473764 | 339569 | 660992 | 200247 | 179799 | 223021 | 437695 | 0.678 | 0.606 | 0.758 | |
| 1965 | 880243 | 633004 | 1224048 | 108045 | 96205 | 121342 | 444930 | 0.578 | 0.514 | 0.65 | |
| 1966 | 1844090 | 1333855 | 2549503 | 121054 | 109013 | 134425 | 483711 | 0.548 | 0.487 | 0.616 | |
| 1967 | 1310906 | 948031 | 1812679 | 128761 | 115864 | 143094 | 572605 | 0.556 | 0.495 | 0.624 | |
| 1968 | 182428 | 131677 | 252740 | 222997 | 203163 | 244768 | 1074084 | 0.599 | 0.536 | 0.669 | |
| 1969 | 110961 | 80030 | 153849 | 148877 | 134375 | 164944 | 1197226 | 0.709 | 0.635 | 0.791 | |
| 1970 | 207795 | 149675 | 288485 | 242004 | 218242 | 268354 | 933246 | 0.698 | 0.625 | 0.778 | |
| 1971 | 406859 | 294328 | 562415 | 330344 | 294058 | 371107 | 689048 | 0.646 | 0.577 | 0.723 | |
| 1972 | 1052424 | 766767 | 1444501 | 353349 | 312102 | 400047 | 565254 | 0.659 | 0.587 | 0.739 | |
| 1973 | 1711725 | 1243345 | 2356549 | 334153 | 291007 | 383695 | 792685 | 0.627 | 0.56 | 0.702 | |
| 1974 | 566788 | 417220 | 769972 | 159026 | 135878 | 186119 | 1102433 | 0.611 | 0.546 | 0.684 | |
| 1975 | 607022 | 445669 | 826792 | 133536 | 119587 | 149111 | 829377 | 0.658 | 0.592 | 0.732 | |
| 1976 | 600127 | 438284 | 821735 | 167187 | 151747 | 184198 | 867463 | 0.705 | 0.635 | 0.783 | |
| 1977 | 371249 | 273380 | 504156 | 335946 | 299959 | 376250 | 905301 | 0.818 | 0.737 | 0.907 | |
| 1978 | 625497 | 458765 | 852825 | 227795 | 199875 | 259615 | 698715 | 0.855 | 0.77 | 0.95 | |
| 1979 | 204057 | 149622 | 278296 | 180383 | 157725 | 206297 | 440538 | 0.772 | 0.694 | 0.859 | |
| 1980 | 131441 | 98688 | 175064 | 108436 | 96869 | 121385 | 380434 | 0.76 | 0.684 | 0.845 | |
| 1981 | 144740 | 110608 | 189404 | 161279 | 146194 | 177921 | 399038 | 0.793 | 0.715 | 0.878 | |
| 1982 | 182264 | 141795 | 234284 | 321325 | 288801 | 357511 | 363730 | 0.774 | 0.7 | 0.857 | |
| 1983 | 140731 | 109488 | 180889 | 311431 | 280593 | 345658 | 289992 | 0.791 | 0.716 | 0.874 | |
| 1984 | 441833 | 347228 | 562213 | 243534 | 222581 | 266459 | 277651 | 0.868 | 0.787 | 0.958 | |
| 1985 | 528650 | 424589 | 658215 | 195541 | 178748 | 213912 | 307920 | 0.81 | 0.734 | 0.894 | |
| 1986 | 1361054 | 1081645 | 1712640 | 163901 | 150099 | 178972 | 430113 | 0.874 | 0.794 | 0.961 | |
| 1987 | 355144 | 281787 | 447598 | 114908 | 104606 | 126225 | 523071 | 0.928 | 0.842 | 1.023 | |
| 1988 | 331994 | 263852 | 417735 | 191457 | 173310 | 211504 | 434939 | 0.885 | 0.794 | 0.986 | |
| 1989 | 158526 | 127189 | 197583 | 237314 | 212827 | 264618 | 332481 | 0.668 | 0.595 | 0.749 | |
| 1990 | 132617 | 104649 | 168058 | 303355 | 266838 | 344869 | 212000 | 0.424 | 0.368 | 0.488 | |
| 1991 | 299280 | 237247 | 377533 | 635806 | 565709 | 714589 | 319158 | 0.408 | 0.358 | 0.465 | |
| 1992 | 714113 | 574019 | 888397 | 801872 | 721261 | 891493 | 513234 | 0.487 | 0.434 | 0.545 | |
| 1993 | 986989 | 793395 | 1227821 | 698491 | 632804 | 770997 | 581611 | 0.587 | 0.527 | 0.653 | |
| 1994 | 749130 | 601448 | 933073 | 568725 | 519659 | 622423 | 771086 | 0.748 | 0.674 | 0.83 | |
| 1995 | 536724 | 431259 | 667981 | 532870 | 486039 | 584213 | 739999 | 0.771 | 0.697 | 0.854 | |
| 1996 | 400745 | 321069 | 500193 | 551369 | 498113 | 610319 | 732228 | 0.791 | 0.715 | 0.876 | |
| 1997 | 772850 | 618928 | 965051 | 546260 | 488948 | 610291 | 762403 | 0.938 | 0.852 | 1.032 | |
| 1998 | 1043689 | 833201 | 1307350 | 386165 | 346209 | 430732 | 592624 | 0.942 | 0.857 | 1.036 | |
| 1999 | 622788 | 496660 | 780947 | 280597 | 252555 | 311752 | 484910 | 0.94 | 0.855 | 1.033 | |
| 2000 | 745072 | 596683 | 930364 | 255138 | 233866 | 278344 | 414868 | 0.849 | 0.77 | 0.937 | |
| 2001 | 590310 | 473196 | 736410 | 383239 | 347133 | 423101 | 426471 | 0.741 | 0.669 | 0.822 | |
| 2002 | 374816 | 301025 | 466696 | 520404 | 471126 | 574838 | 535045 | 0.682 | 0.615 | 0.756 | |
| 2003 | 758231 | 610705 | 941395 | 570813 | 518018 | 628988 | 551990 | 0.637 | 0.573 | 0.709 | |
| 2004 | 242815 | 198411 | 297155 | 664368 | 603916 | 730870 | 606445 | 0.711 | 0.641 | 0.789 | |
| 2005 | 692086 | 564235 | 848906 | 576671 | 525642 | 632655 | 641276 | 0.716 | 0.643 | 0.797 | |
| 2006 | 538831 | 439149 | 661139 | 579579 | 528937 | 635069 | 537642 | 0.615 | 0.549 | 0.69 | |
| 2007 | 1255333 | 1018126 | 1547806 | 644011 | 584199 | 709947 | 486883 | 0.449 | 0.398 | 0.506 | |
| 2008 | 1015424 | 818187 | 1260209 | 712366 | 646771 | 784613 | 464171 | 0.366 | 0.323 | 0.415 | |
| 2009 | 591345 | 475309 | 735708 | 1001388 | 911248 | 1100444 | 523430 | 0.312 | 0.273 | 0.356 | |
| 2010 | 206731 | 161844 | 264066 | 1229135 | 1116992 | 1352537 | 609983 | 0.296 | 0.259 | 0.338 | |
| 2011 | 365681 | 288806 | 463018 | 1782709 | 1613658 | 1969470 | 719830 | 0.313 | 0.274 | 0.358 | |
| 2012 | 510602 | 409951 | 635966 | 1997429 | 1801933 | 2214136 | 727663 | 0.295 | 0.258 | 0.338 | |
| 2013 | 469476 | 372948 | 590989 | 2211080 | 1987269 | 2460098 | 966209 | 0.322 | 0.282 | 0.367 | |
| 2014 | 849995 | 680610 | 1061536 | 2089429 | 1868257 | 2336785 | 986449 | 0.34 | 0.298 | 0.387 | |
| 2015 | 449183 | 363260 | 555428 | 1676734 | 1490336 | 1886445 | 864384 | 0.339 | 0.299 | 0.384 | |
| 2016 | 283071 | 226982 | 353021 | 1335743 | 1188294 | 1501487 | 849422 | 0.359 | 0.317 | 0.407 | |
| 2017 | 760664 | 613566 | 943027 | 1363003 | 1232725 | 1507049 | 868276 | 0.393 | 0.347 | 0.444 | |
| 2018 | 486272 | 384693 | 614674 | 1226591 | 1113929 | 1350648 | 778627 | 0.411 | 0.363 | 0.465 | |
| 2019 | 622063 | 497411 | 777954 | 1161583 | 1050075 | 1284932 | 692609 | 0.429 | 0.38 | 0.484 | |
| 2020 | 529571 | 420661 | 666679 | 923962 | 834092 | 1023515 | 692903 | 0.479 | 0.425 | 0.54 | |
| 2021 | 368238 | 288158 | 470574 | 792317 | 714444 | 878678 | 767284 | 0.561 | 0.494 | 0.637 | |
| 2022 | 182355 | 137222 | 242331 | 674790 | 597676 | 761853 | 719211 | 0.582 | 0.501 | 0.677 | |
| 2023 | 231028 | 168283 | 317168 | 709740 | 599149 | 840745 | 582552 | 0.589 | 0.482 | 0.719 | |
| 2024 | 587000* | 552219 | 418582 | 728522 | |||||||
* Recruitment model estimate.
References
Howell et al. 2024. Report of the Joint Russian-Norwegian Arctic Fisheries Working Group (JRN-AFWG). IMR PINRO 2024-7. https://www.hi.no/hi/nettrapporter/imr-pinro-en-2024-7
ICES. 2003. Report of the Study Group on Biological Reference Points for Northeast Arctic Cod, 13–17 January 2003, Svanhovd, Norway. ICES CM 2003/ACFM:11. 39 pp.
ICES. 2016. Report of the second Workshop on Management Plan Evaluation on Northeast Arctic cod and haddock and Barents Sea capelin (WKNEAMP-2), 25-28 January 2016, Kirkenes, Norway. ICES CM 2016/ACOM:47, 76 pp.
ICES. 2017. Report of the Arctic Fisheries Working Group (AFWG), 19–25 April 2017, ICES HQ, Copenhagen, Denmark. ICES CM 2017/ACOM:06. 493 pp.
ICES. 2021. Benchmark Workshop for Barents Sea and Faroese Stocks (WKBARFAR 2021).
ICES Scientific Reports. 3:21. 205 pp. https://doi.org/10.17895/ices.pub.7920
ICES 2024 AFWG