The Ecosystem response to darkening of the coastal zone – food web implications project was financed as pilot study within the to acquire preliminary knowledge on how the coastal ¨darkening¨ phenomenon affects plankton composition, distribution, and dynamics. The data collected provide base knowledge for future research focusing on the effects of increased river runoff due to changing climate on the flow of energy and carbon within the lower food web and ultimately, the potential repercussions on fish recruitment.
Ecosystem response to darkening of the coastal zone – food web implications
— Pilot Study
Report series:
Rapport fra havforskningen 2023-7
ISSN: 1893-4536
Published: 17.02.2023
Project No.: 15593-04
Research group(s):
Plankton
,
Oseanografi og klima
,
Økosystemprosesser
Program:
Kystøkosystemer
Approved by:
Research Director(s):
Geir Huse og Geir Lasse Taranger
Program leader(s):
Jan Atle Knutsen
Preface
1 - Rationale
Climate change is affecting marine ecosystems in an unprecedented manner. Coastal areas are subject to both large scale seasonal changes and increasingly, fluctuating stressors that can alter marine communities and consequently, affect ecosystem services essential to humans. Changes in river runoff can have major effects on the pelagic marine communities and thus, on food web structure and energy transfers by modifying for example nutrient supply, organic carbon availability and light irradiance.
Increased access to dissolved nutrients can increase primary production, which in turn supports higher trophic levels production (zooplankton, fish). However, increased concentration of particulate organic matter (POM, cDOM), can reduce the availability of light and thus, the ability of phytoplankton to photosynthesize. At the same time, dissolved organic matter (DOM) will stimulate bacterial production and thus, their major consumers, small heterotrophic plankton (pico- and nanoplankton). The switch from a system dominated by phytoplankton to one dominated by bacteria can lead to major ecosystem structural changes and a potential shift from autotrophic to heterotrophic production. A system where the microbial food network dominates has a longer food chain with several trophic links and thereby, less energy to support higher trophic levels (e.g. fish). Moreover, darker water can favor tactile predators (jellies) compared to visual predators such as fish with significant repercussion on coastal ecosystems.
Thus, it is of paramount importance to document how changes in the coastal runoff can affect primary producers and their activities and, consequently the interactions with microbial components such as bacteria, pico-, nano- and microplankton as well as mesozooplankton and jellies. Coastal darkening is a phenomenon that it is increasingly affecting Norwegian coastal ecosystems and its overall impact on the planktonic ecosystem can have major repercussions on many ecosystem services of fundamental importance to human well-being, health, livelihoods, and survival (i.e. fisheries and fish recruitment, water purification, shoreline protection, recreation). A better knowledge of these dynamics will improve our ability to anticipate ecosystem responses and provide science-based management advice particularly in today changing climate conditions and increased man-made disturbances.
2 - Main Objectives
The main objective of this pilot study was to survey Sandnesfjord to acquire data on the status of the plankton community in association with river discharge on a seasonal base.
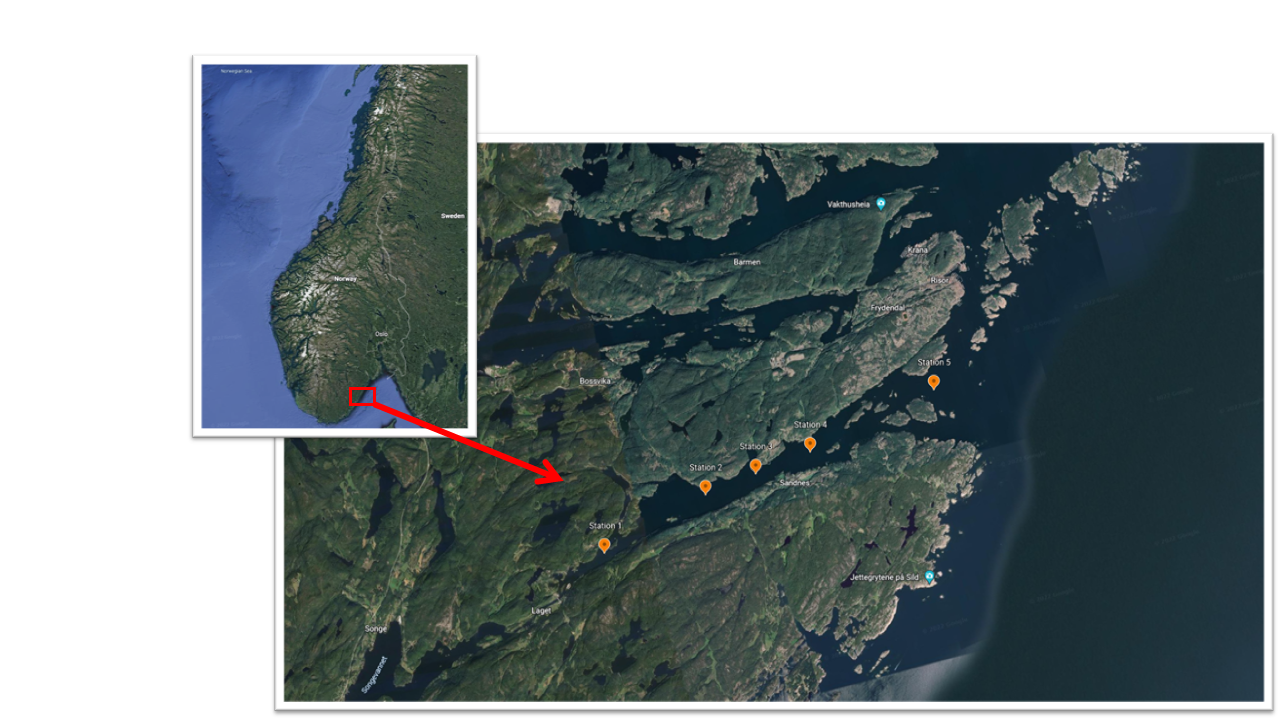
The collaboration with ongoing coastal monitoring projects was essential for our ability to collect samples. This included cruises onboard GM Dannevig, conducted as part of the project 15593 (“Langtidsovervåkning og forskning på kystmiljø og plankton” and “Økokyst Skagerrak”). Utilizing the coastal monitoring sampling platform, we were able to acquire samples almost on a monthly base from January to September. During the monthly cruise with the F.F. G.M. Dannevig. Sandnesfjord was characterized at 5 stations along the axis that extends from the innermost fjord areas to the outer exposed coastal areas of the fjord (Figure 1). The five stations, numbered 1 to 5 from the inner to the outer fjord area, have been sampled for physical, chemical, and biological parameters in January, February, March, April, June, August and September.
The sample analyses have started immediately, however, some of the analyses are still underway so this report will give a preliminary overview of the project.
| Nr. | Lat | Long | FRA CTD Sensor | VANNPRØVER | ||||||||||||
|---|---|---|---|---|---|---|---|---|---|---|---|---|---|---|---|---|
| CTD | Light - profile | cDOM | Oxygen* | Fluoresc | N .salt | ToT NP | Ammon. | DOC | TSM | Klorofyll | Pico- plankton | Phyto/ Microzoo | WP2-Håv | |||
| 1 | 58.69 | 9.09 | x | 0-bunn | 0-bunn | 0-bunn | 0-bunn | 0-bunn | 0-30 m | 0-30 m | 0-30 m | 0-2-5m | 0-30 m | 5m | 5 m | |
| 2 | 58.69 | 9.12 | x | 0-bunn | 0-bunn | 0-bunn | 0-bunn | 0-bunn | 0-30 m | 0-30 m | 0-30 m | 0-2-5m | 0-30 m | 5m | 5 m | |
| 3 | 58.69 | 9.15 | x | 0-bunn | 0-bunn | 0-bunn | 0-bunn | 0-bunn | 0-30 m | 0-30 m | 0-30 m | 0-2-5m | 0-30 m | 5m | 5 m | |
| 4 | 58.70 | 9.17 | x | O-bunn | 0-bunn | 0-bunn | 0-bunn | 0-bunn | 0-30 m | 0-30 m | 0-30 m | 0-2-5m | 0-30 m | 5m | 5m | 0-bunn |
| 5 | 58.70 | 9.21 | x | 0-bunn | 0-bunn | 0-bunn | 0-bunn | 0-bunn | 0-30 m | 0-30 m | 0-30 m | 0-2-5m | 0-30 m | 5m | 5 m | |
3 - Preliminary Results
3.1.1 - Ecosystem physical characterization
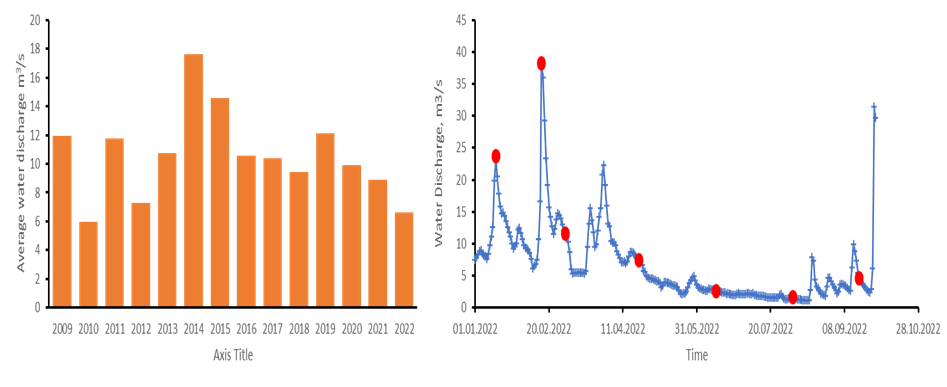
Sandnesfjord is affected by freshwater discharge from Lundevannet. The data collected by the Lundevannet sensor managed by Norwegian Water Resources and Energy Directorate provides data on freshwater dynamic that affect Sandensfjord. Daily measures for the period under analysis show water discharge ranging between 1.12 to 38 m3/s. The comparison of these measurements with the one obtained for the last 14 years in the period January-September, showed that on average the water discharge recorded in 2022 was amongst the lowest of the time series (Figure 2a). Nevertheless, two of our winter sampling, in January and February, occur during the highest discharge event recorded this year (Figure 2b). However, it is important to keep in mind that the fresh water reaches Sandnesfjord with some days of delay compared to the discharge event recorded.
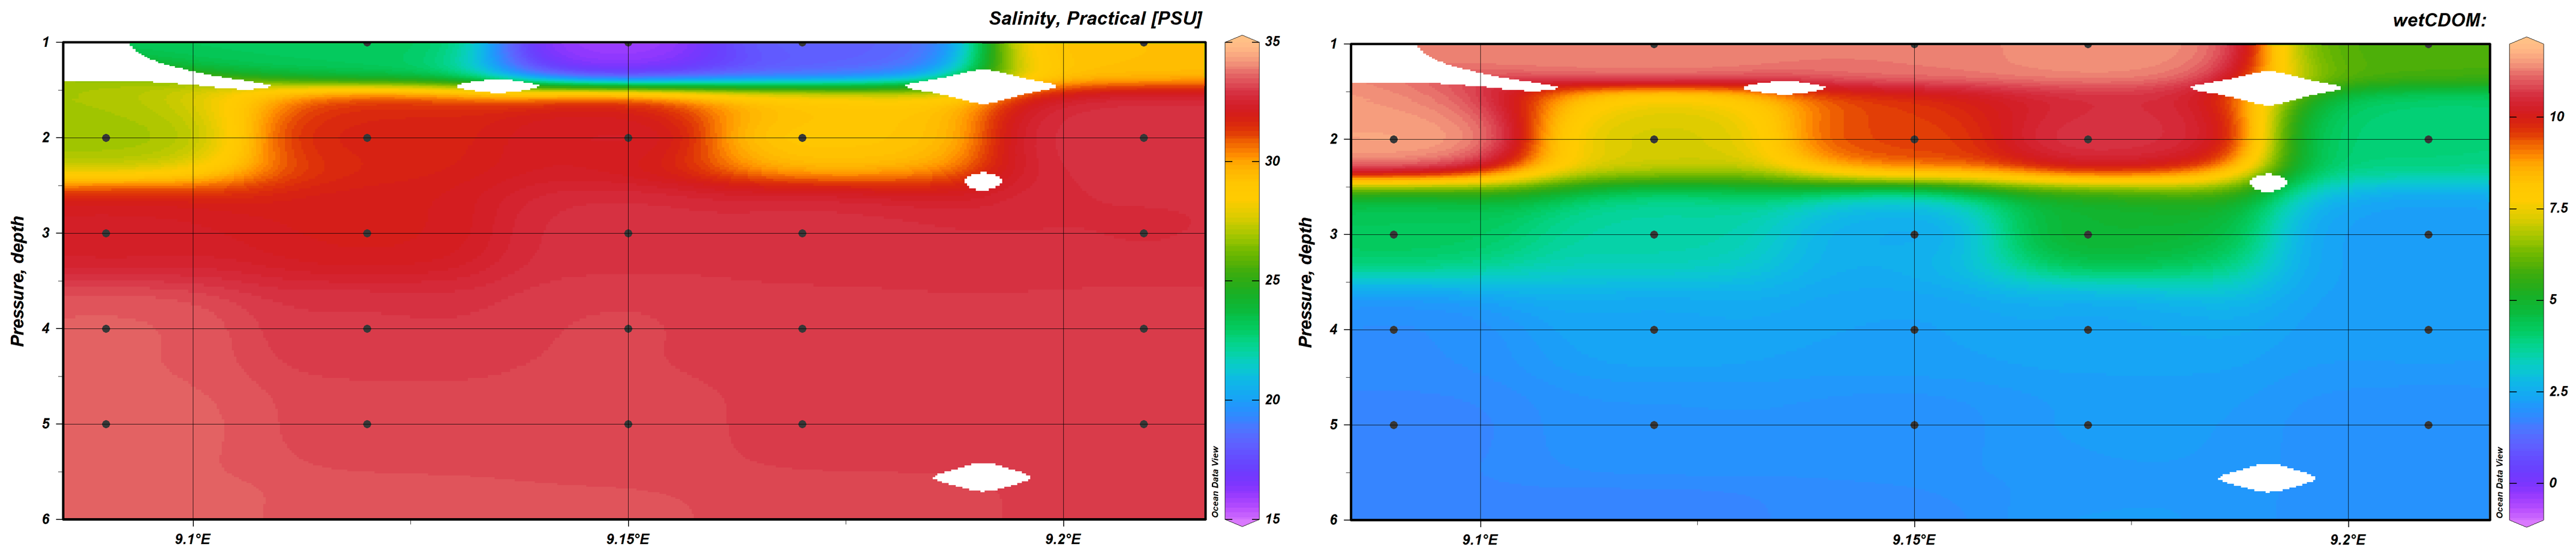
Despite the overall 2022 low discharge, the signal of the freshwater entering the fjord was always detected in the upper 2m of the water column. In this surface layer the changes in physical parameters from the inner (St.1) to the outer (St.5) fjord area were the strongest (Figure 3). For instance, in February the freshwater inflow signal was strong at station 1 where we measured lower salinity (25PSU) and high values of cDOM (11.4) while, moving outward, the mixing with open ocean water diluted the freshwater influence, thus at station 5 salinity reached 30PSU and cDOM 5 (Figure 3a-b). The particulate material transported by the riverine water is expected to have major effect of plankton physiology due to its potential of reducing light availability for autotrophic plankton. cDOM accumulation can reduce the depth of the euphotic zone and thus the amount of primary production produced in the system. As matter of fact, in our study we observed a negative significant relationship (p<0.001) between cDOM and Chlorophyll a which could reflect the impaired ability of phytoplankton to photosynthesize when exposed to reduced light availability.
Chlorophyll a concentration was higher during the spring-summer months compared to the winter months. The inner most station, St.1 presented the largest span in chlorophyll a concentration ranging between 0.1 µg/L in January to 2.15 µg/l in June, which represent also the highest value recorded in this study.
3.1.2 - Plankton Composition
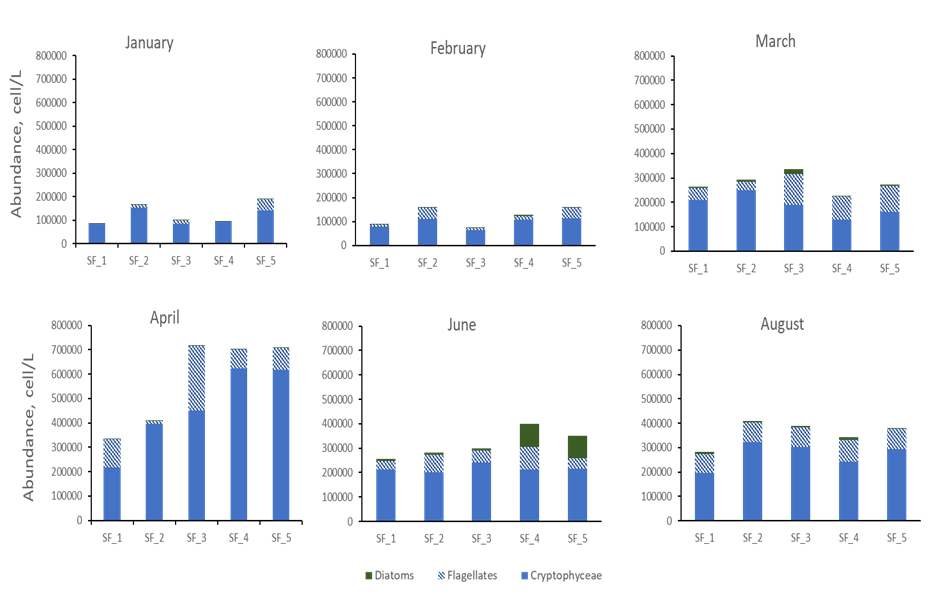
Sandnesfjord phytoplankton community was dominated by cells smaller than 5µm at all stations and seasons. Flagellates and Cryptophytes represented on average more than 60% of the entire phytoplankton population abundance (Figure 4). Their abundances increased over 10 orders of magnitude from February to April while their distribution was homogeneous between stations except in April when the three outer most stations presented double abundance compared to the two inner ones. The analytical resolution we have at the moment of these small autotrophic cells does not provide detailed information of their trophic status and physiological state. Analyses able to detect and measure physical and chemical characteristics of these particles (i.e. Flowcytometry) would help characterize the nanoplankton community and detect a possible switch from autotrophic to heterotrophic dominated system.
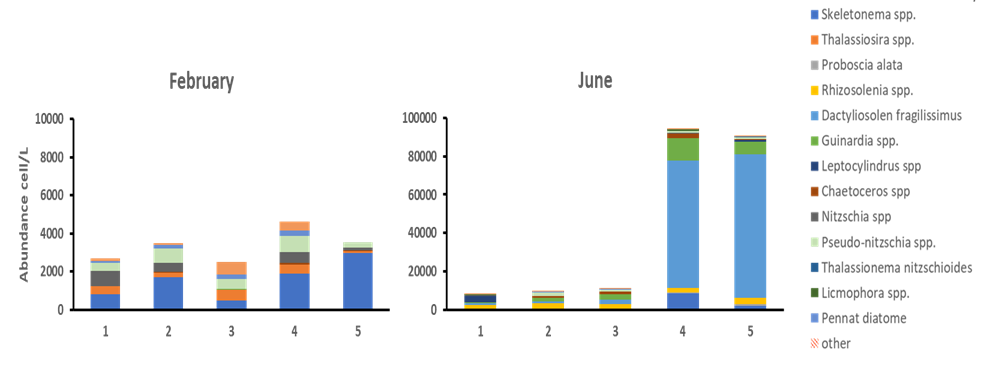
The taxonomical resolution we have of the diatom component of the phytoplankton community is, on the other hand, much greater. During our study diatoms were present in low abundances (<5000 cell/L) during winter, however, a bloom was recoded in June, at station 4 and 5 when diatoms represented up to 25% of the total phytoplankton abundance (Figure 4d). Despite their overall lower numeric contribution compared to flagellates and cryptophytes, diatoms are responsible for large part of the primary production in the ocean and, being preferred prey for both micro and mesozooplankton, they serve as carbon fuel for all the higher trophic levels. Thus, it is of paramount importance to monitor their population dynamics.
In term of community composition, Sandnesfjord diatom population was quite diverse with a total of 34 species (morpho species) identified through microscopy. However, only 13 of these represented more than 10% of the population at any time. Between these, few species presented recognizable pattern at this stage of the analysis. For instance, Thalassiosira sp and Nitzschia spp. were exclusively or in greater numbers (respectively) during the winter months, while species such as Proboscia alata, Rhizosolenia spp. and Dactyliosolen fragilissimus were only present in June and August (Figure 5a-b). As matter of fact, the large diatom bloom observed in June at station 4 and 5, with abundances that reached up to 950000 cell/L was almost exclusively dominated by Dactyliosolen fragilissimus, a species commonly found in the Skagerrak area in summer (Figure 5b).
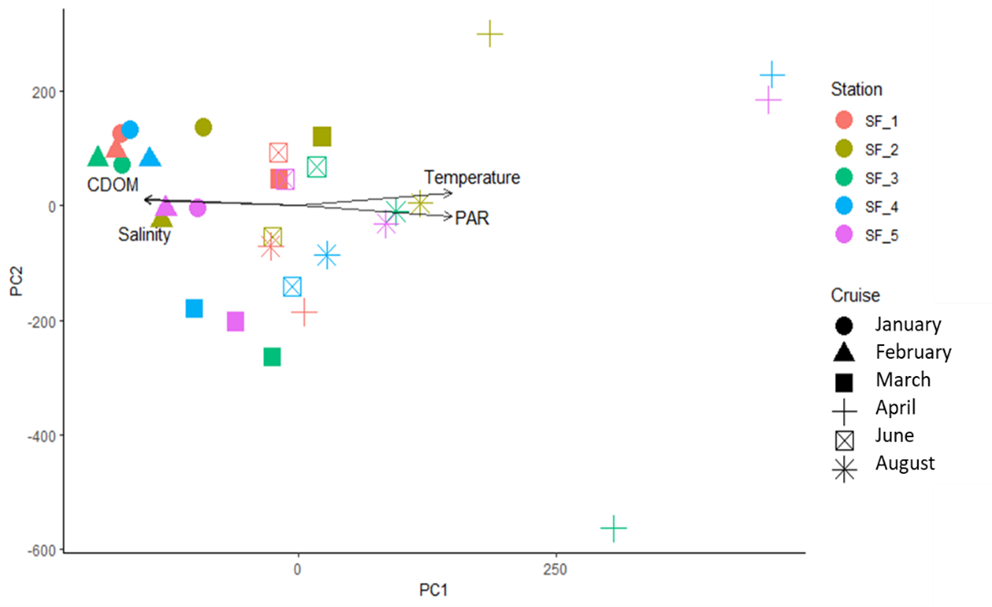
Overall, the phytoplankton community composition presented a strong seasonal pattern with winter samples (full markers) pulling apart from spring/summer samples (open markers) (Figure 6). The influence of environmental factors on phytoplankton community composition was significant when considering salinity, CDOM and PAR (p=0.001; p= 0.044 and p=0.005, respectively). Analysis of nutrients concentrations are still underway thus, these parameters are not included in this elaboration.
The PCA analysis did not show strong differences in the phytoplankton community along the inner outer gradient. However, it is likely that the collection of additional samples will provide new significant insights of the planktonic structure in the fjord.
3.1.3 - Micro and Mesozooplankton
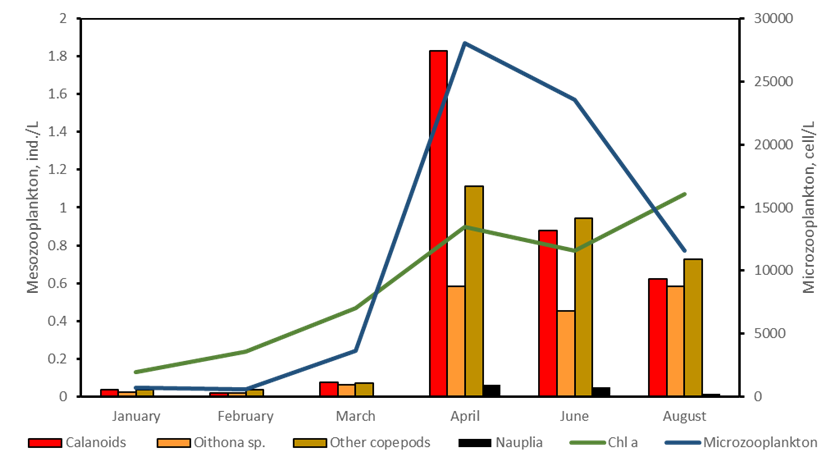
Microzooplankton, small mixotrophic/heterotrophic primary consumers, were mostly composed by dinoflagellates and ciliates. Within the dinoflagellates, small gymnodiniales dominated in winter while in summer Dinophysis, Prorocentrum sp. and Torodinium sp. represented large percentage of the population. Ciliates were dominated by the naked component mostly Strombidium spp. and Strobilidium spp. while tintinnids represented only a small fraction of the entire population. Microzooplankton number ranged between 20 cell/L in winter and 28000 cell/L in April in association with high Chlorophyll a concentration.
Mesozooplankton samples were collected only at the deepest station, station 4, toward the outer pat of the Fjord. The imaging analysis reveled that zooplankton population was quite low during winter while the number significantly increase in Spring in conjunction with both phytoplankton bloom and microzooplankton increasing abundances. Within the mesozooplankton, copepods were the most abundant component, particularly calanoids copepods however, the small copepod Oithona sp. also represented a large part of the community in all seasons (Figure 7).
4 - Conclusions
The pilot project Ecosystem response to darkening of the coastal zone food web implications delivered a first understanding of the planktonic community that characterize Sandnesfjord. We want to emphasize that the data presented are only preliminary results. More cohesive understanding can come when analysis such as nutrients concentration and bacterial counts, will be completed. Moreover, due to the extremely dry conditions that characterized the 2022, the data collected should be used as reference base for dry years. Investigating the development of the trophic status of the smallest planktonic component could inform on the possible autotrophic/heterotrophic switch sparkled by the increased darkening of the fjord water and help in formulating early advice. These data, together with new data collected in 2023 will also be used to calibrate a model on the effect of darkening on the Norwegian coast that will be developed through the project PELAGIC, just funded by NFR.
5 - Acknowledgement
We are grateful to the Captain and crew of the GM Dannevig and all the engineers of the plankton group that worked on collecting and analyzing the samples. Without their contributions this project would have not been possible.