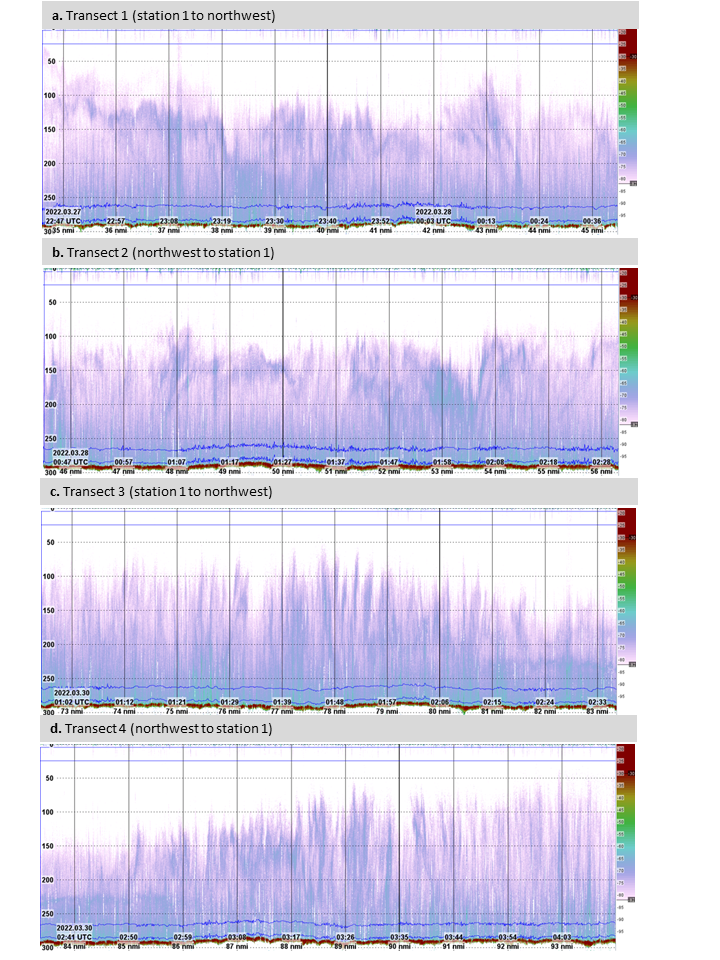
Figure 16. S v echogram showing the acoustic backscatter from the transects in northeastern direction from the planned windfarm. In panels a and c the transect started at the planned windfarm and moved away while in panels b and d the transect started 10 nm northeast of the windfarm and moved toward it. The vertical axes show meters below the surface and the horizontal axes a nominal distance in nautical miles and associated date and time in UTC. The displayed Sv range is from – 40 to – 85 dB. The bottom depth was constant at 290 m.