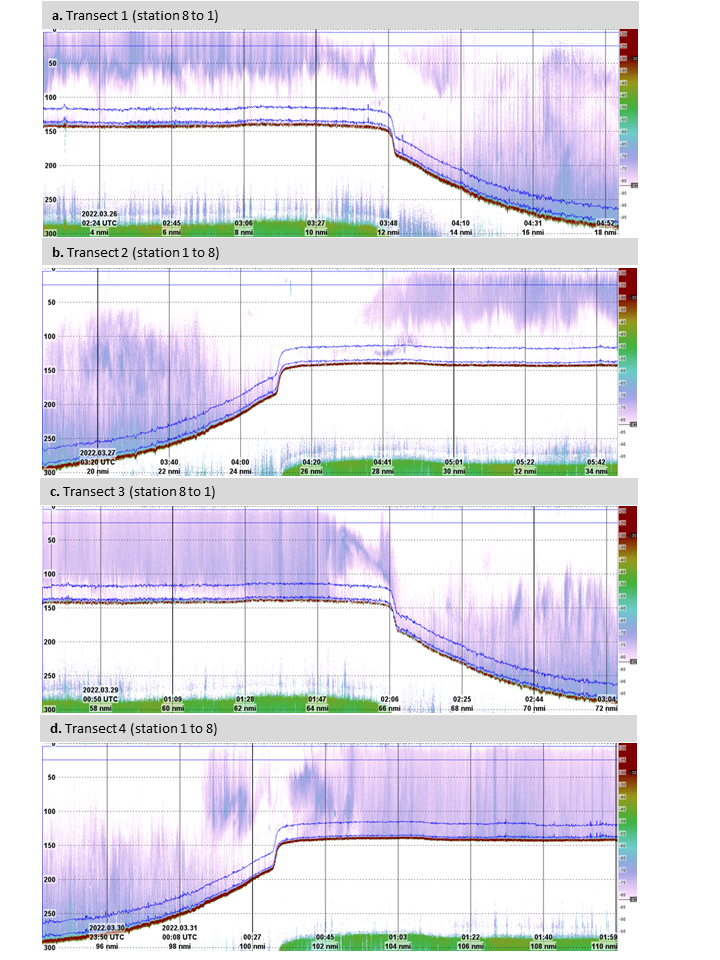
Figure 15. S v echogram showing the acoustic backscatter from the transects in southwestern direction from the planned windfarm (covering stations 1 – 8). In panels a and c the transect was covered from station 1 to 8, i.e. starting close to the planned windfarm and moving 20 nm SW in panels b and d the transect was covered from station 8 to 1, i.e. starting 20 nm southwest of the windfarm and moving toward it. The vertical axes show meters below the surface and the horizontal axes a nominal distance in nautical miles and associated date and time in UTC. The displayed Sv range is from – 40 to – 85 dB. SW/NE transects have a varying bottom depth and NW/SE transects have a constant bottom depth at 290 m.