Gå til hovedinnhold
Havforskningsinstituttet
HI
English
<- Tilbake
Søk
Søk
Søk
View page in English
Figur
Fra rapporten:
Panel-based Assessment of Ecosystem Condition of the Norwegian Sea Pelagic Ecosystem
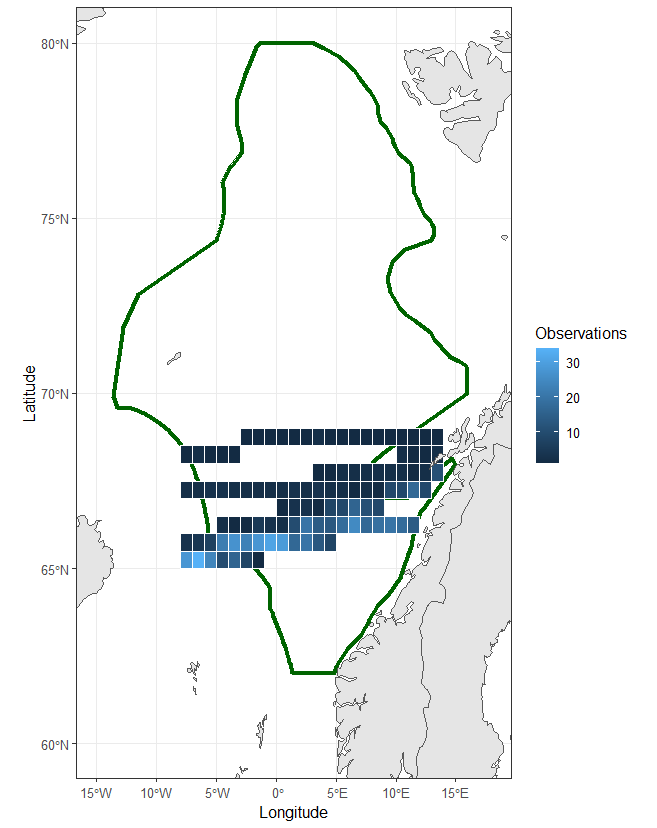
Figure 4.1. Location of grid cells from which CPR data have been used for the assessment and number of data points for each cell. The assessed area is indicated by the solid line.