5 - Methods used to assess deviation from the reference condition
Deviation from the reference condition was assessed by comparing the expected variation in an indicator’s value with increasing human pressure (phenomenon, see short titles in Table 5.1 and full descriptions in section 5.1) to observed trend in the indicator’s data (see 4.2). If the fitted trend on the observed data was similar to what is expected given the observed variation in the relevant anthropogenic drivers (see Appendix 8.2), then there is evidence for deviation from the reference condition.
| Indicator [ID] |
Phenomenon [ID] |
Anthropogenic drivers |
Approach |
| Annual primary productivity [NwI01] |
Decreasing primary production [NwP01] |
Climate change |
2) and 3) |
| Timing of the spring bloom [NwI02] |
Change in timing of spring bloom [NwP02] |
Climate change |
2) and 3) |
| Mesozooplankton biomass relative to pelagic fish biomass [NwI03] |
Change in relative biomass of mesozooplankton to pelagic fish OR change in biomass ratio of mesozooplankton and pelagic fish [NwP03] |
Fisheries and climate change |
2) and 3) |
| High trophic level seabirds [NwI04] |
Decreasing populations of pelagic high TL seabirds [NwP04] |
Fisheries and climate change |
2) and 3) |
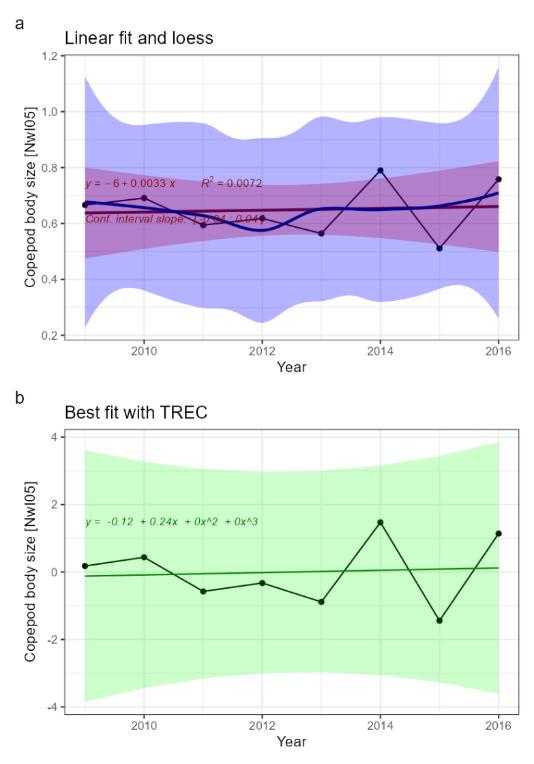
| Copepod body size [NwI05] |
Decreasing average copepod body size [NwP05] |
Climate change |
2) and 3) |
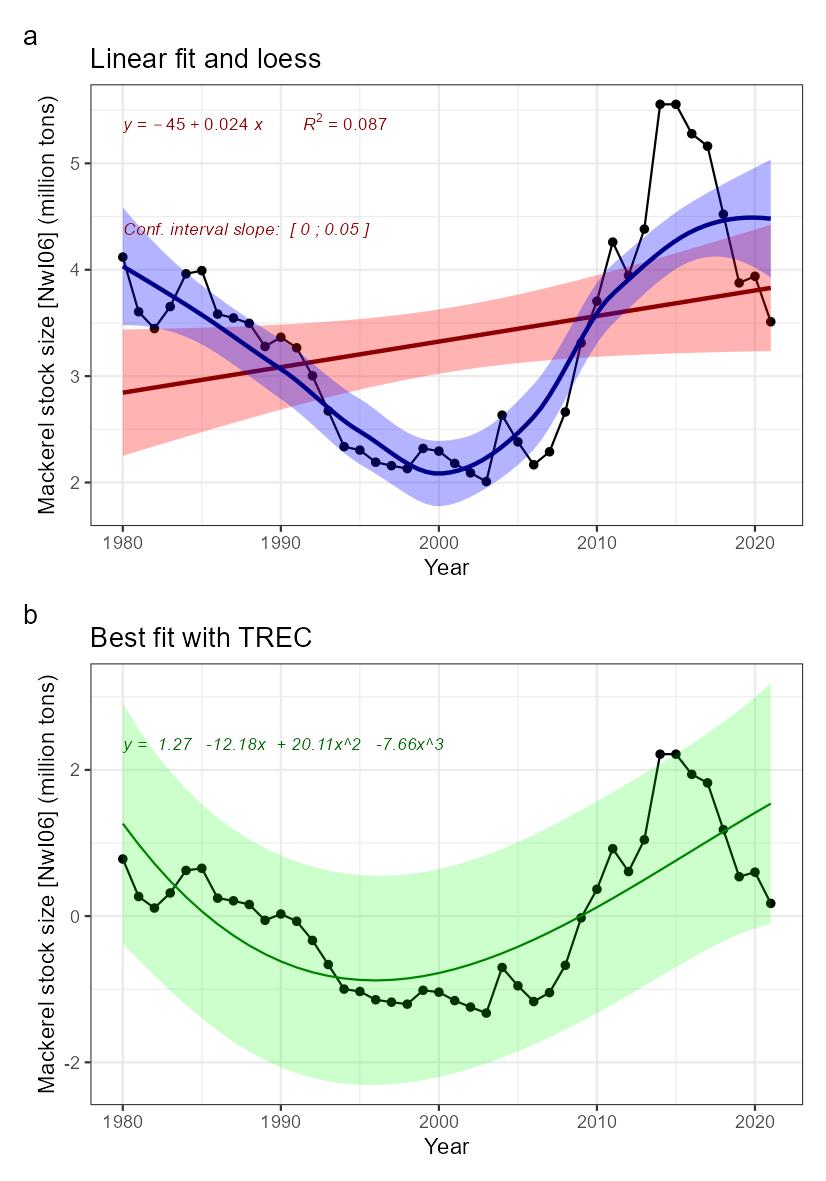
| Mackerel stock size [NwI06] |
Decreasing mackerel stock size [NwP06] |
Fisheries and climate change |
2) and 3) |
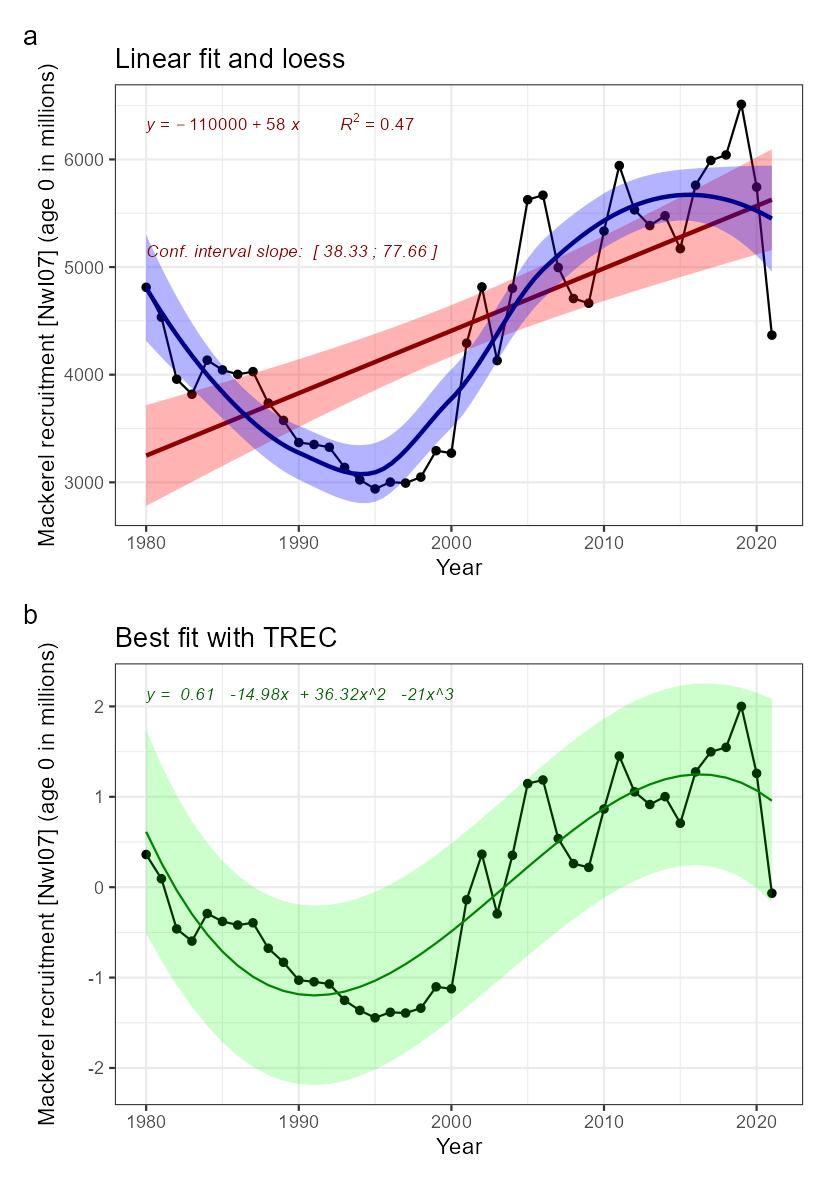
| Mackerel recruitment [NwI07] |
Change in mackerel recruitment [NwP07] |
Fisheries and climate change |
2) and 3) |
| Herring stock size [NwI08] |
Decreasing herring stock size [NwP08] |
Fisheries |
2) and 3) |
| Herring recruitment [NwI09] |
Decreasing herring recruitment [NwP09] |
Fisheries |
2) and 3) |
| Blue whiting stock size [NwI10] |
Decreasing blue whiting stock size [NwP10] |
Fisheries |
2) and 3) |
| Blue whiting recruitment [NwI11] |
Decreasing blue whiting recruitment [NwP11] |
Fisheries |
2) and 3) |
| Calanus finmarchicus productivity [NwI12] |
Decreasing Calanus finmarchicus production [NwP12] |
Climate change |
2) and 3) |
| Copepod species vulnerable to climate warming [Nw13] |
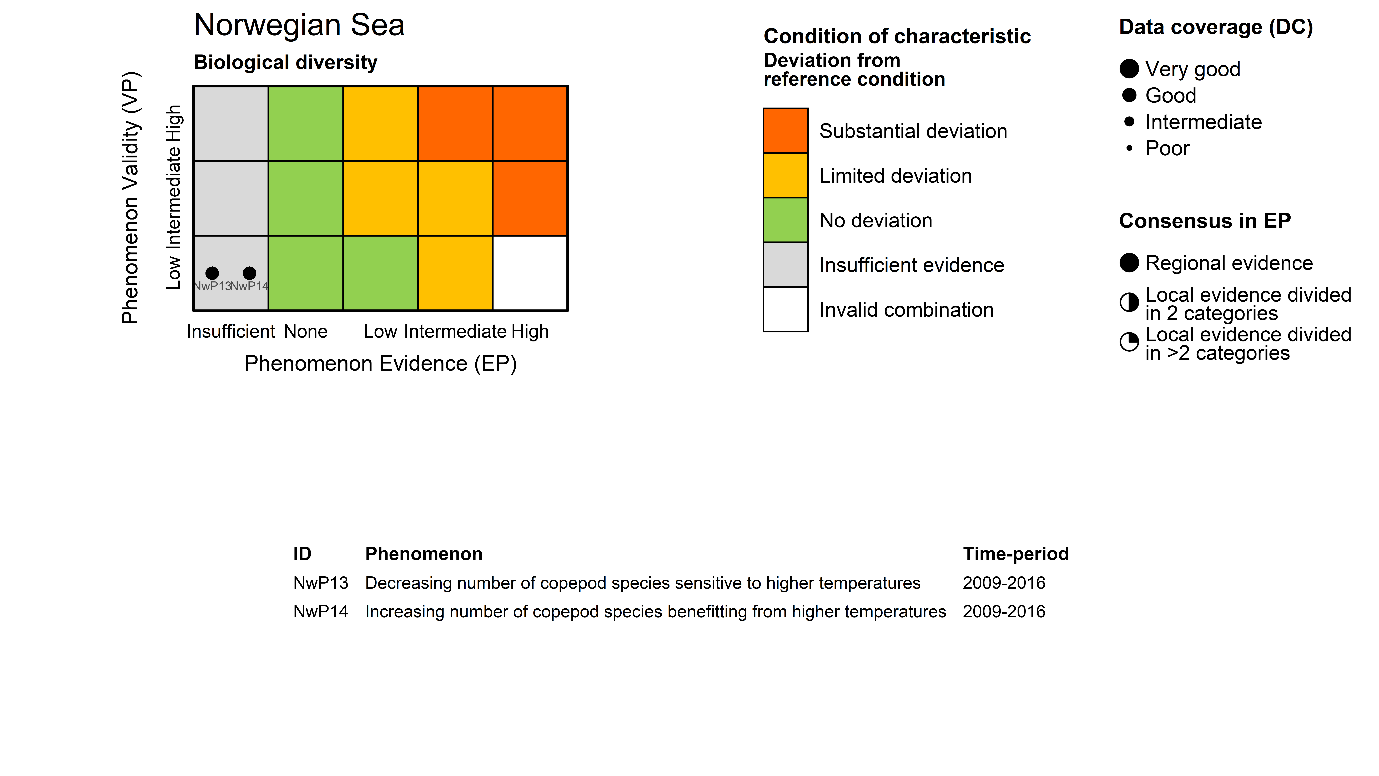
Decreasing number of copepod species sensitive to higher temperatures [NwP13] |
Climate change |
2) and 3) |
| Copepod species benefitting from climate warming [NwI14] |
Increasing number of copepod species benefitting from higher temperatures [NwP14] |
Climate change |
2) and 3) |
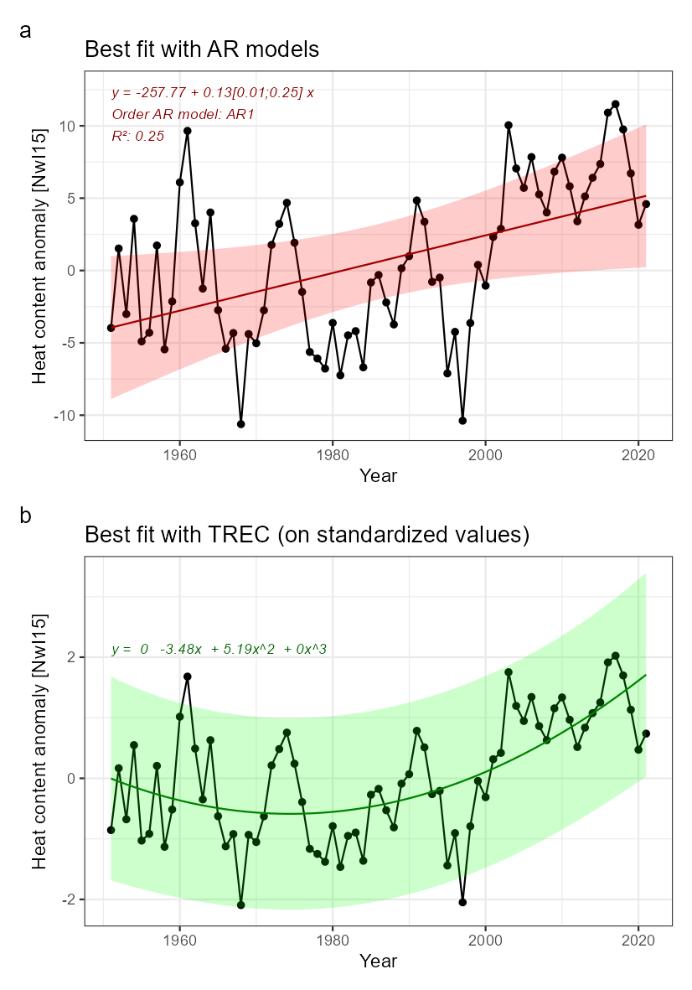
| Heat content [NwI15] |
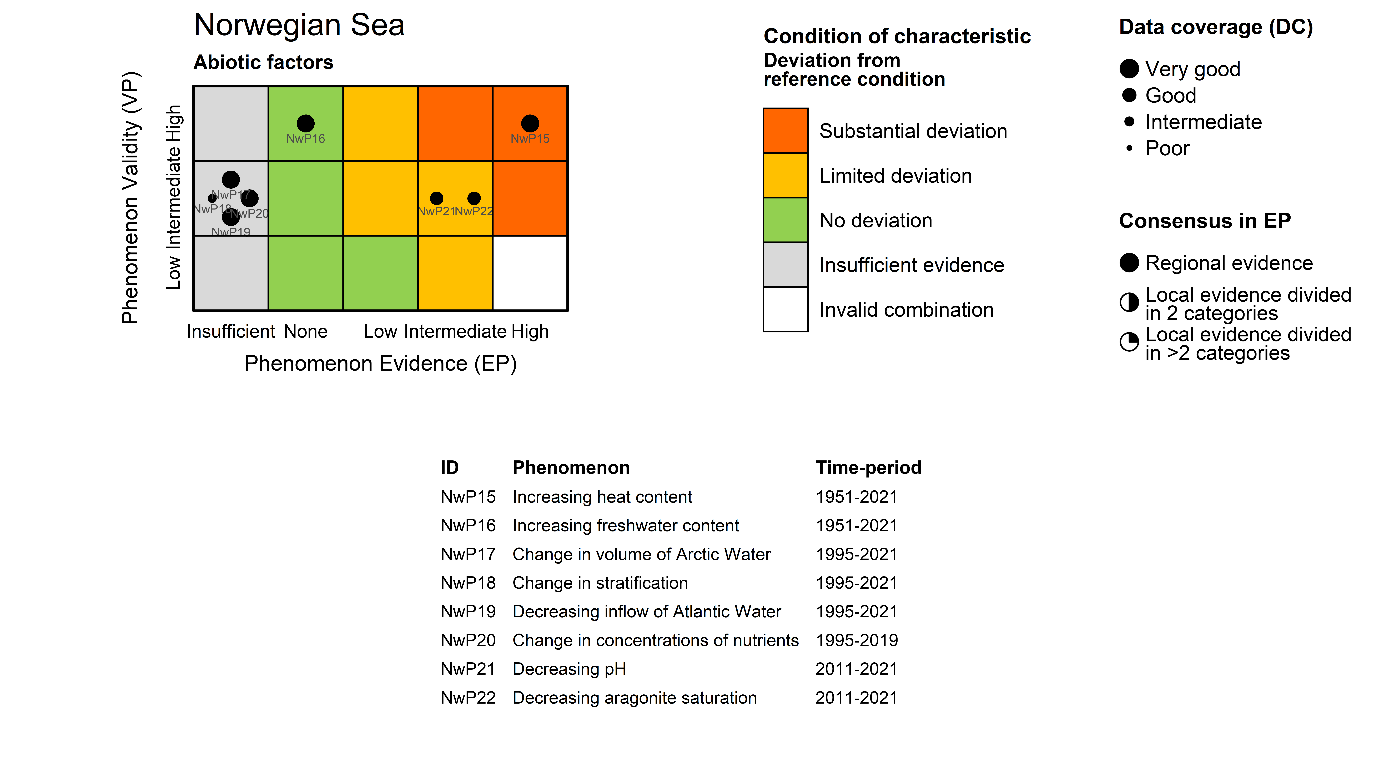
Increasing heat content [NwP15] |
Climate change |
2) and 3) |
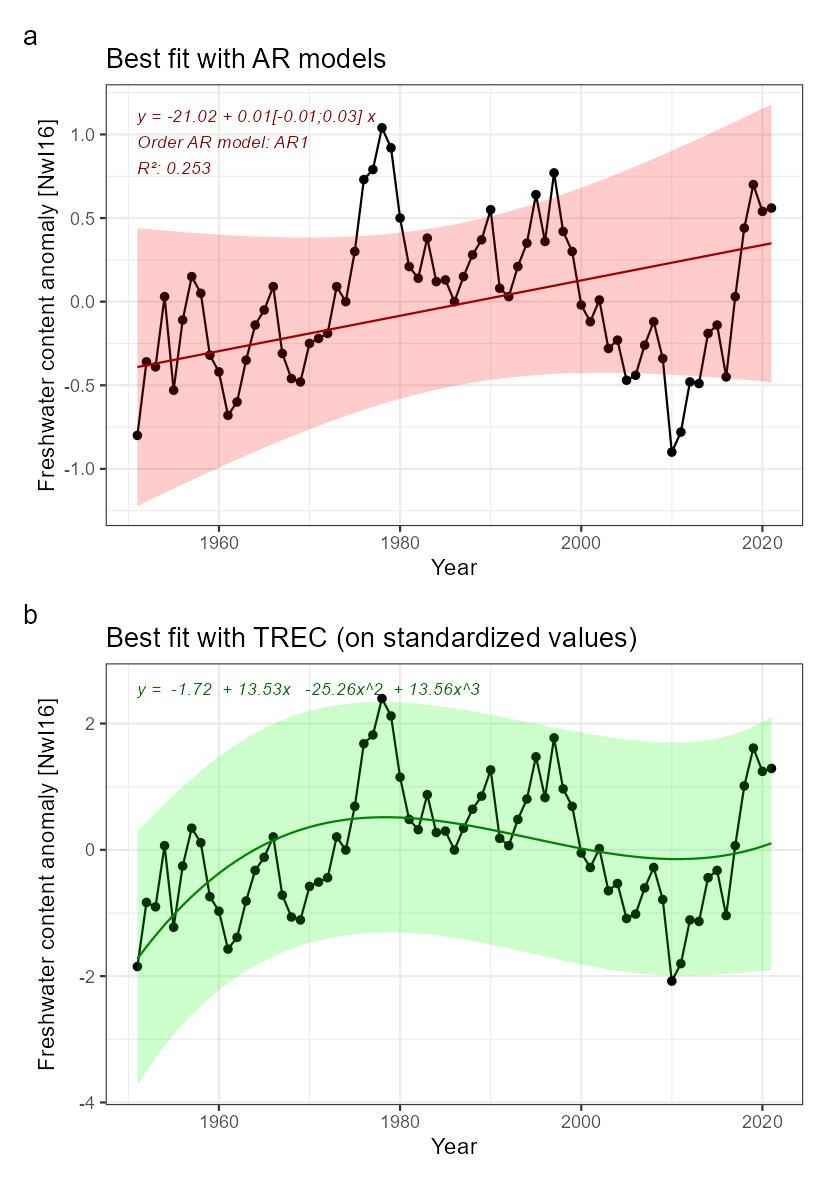
| Freshwater content [NwI16] |
Increasing freshwater content [NwP16] |
Climate change |
2) and 3) |
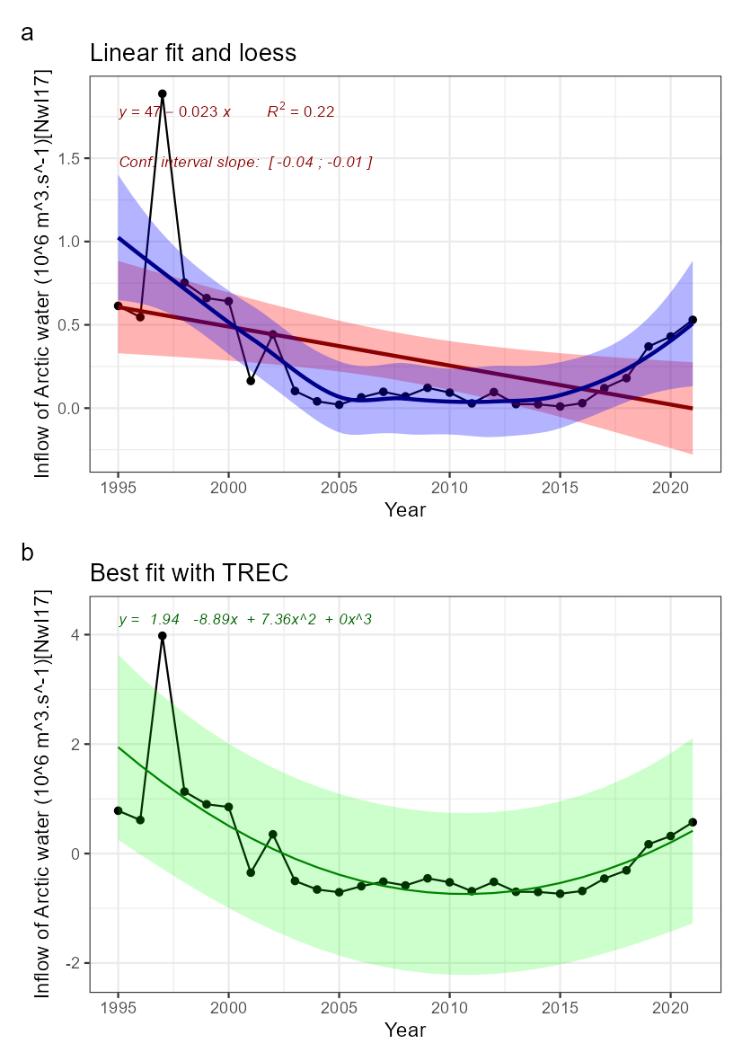
| Inflow of Arctic water [NwI17] |
Change in volume of Arctic Water [NwP17] |
Climate change |
2) and 3) |
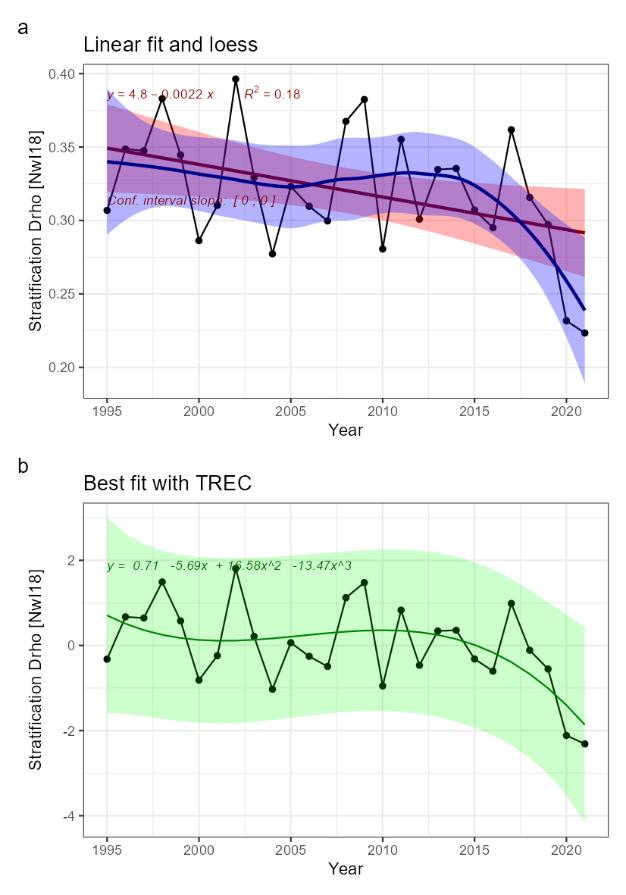
| Stratification [NwI18] |
Increasing stratification [NwP18] |
Climate change |
2) and 3) |
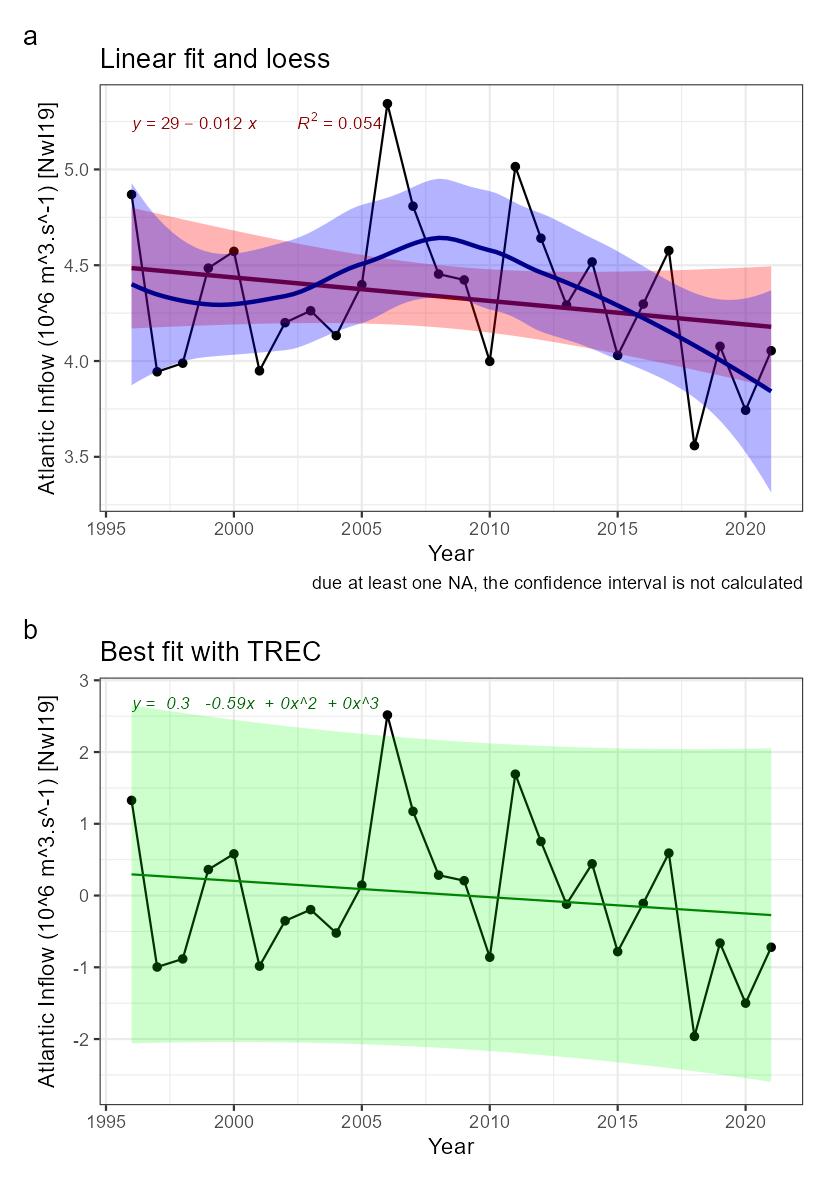
| Inflow of Atlantic water [NwI19] |
Decreasing inflow of Atlantic Water [NwP19] |
Climate change |
2) and 3) |
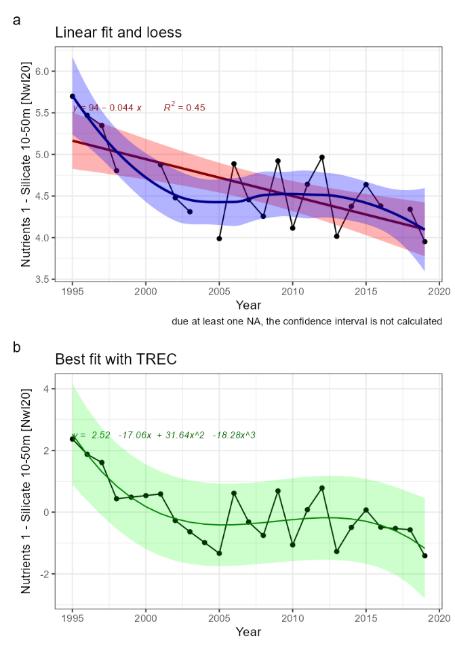
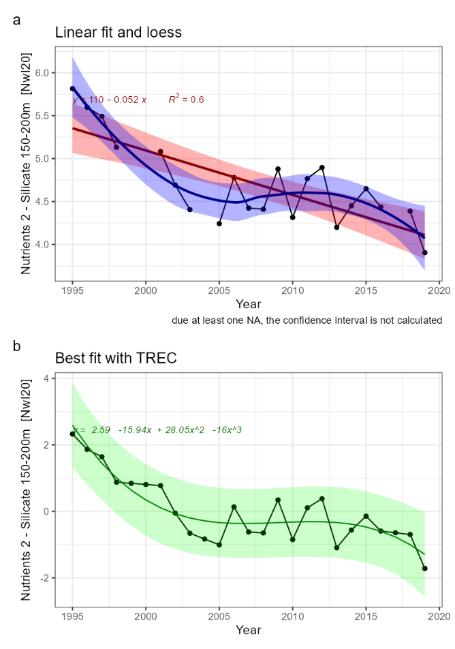
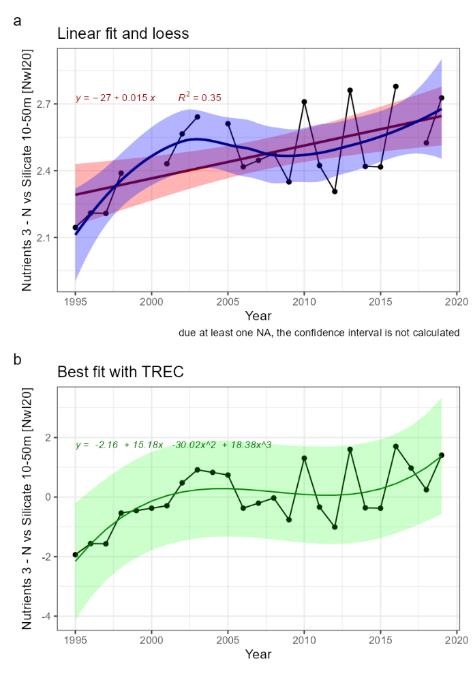
| Nutrients [NwI20] |
Change in concentrations of nutrients [NwP20] |
Climate change |
2) and 3) |
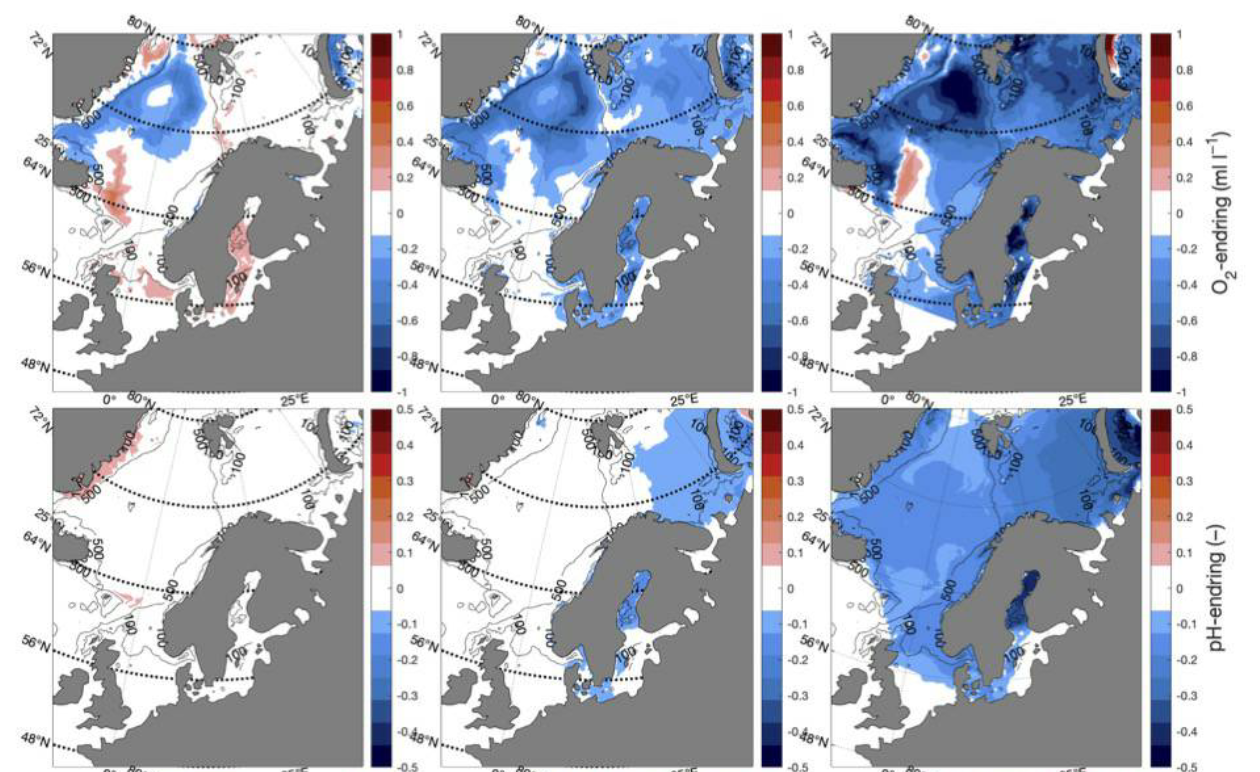
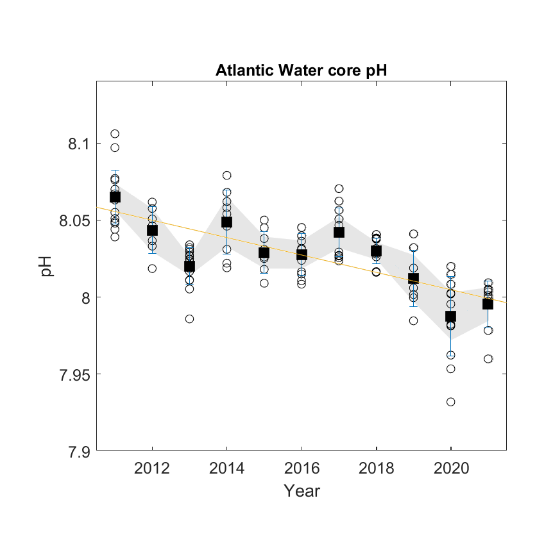
| pH [NwI21] |
Decreasing pH [NwP21] |
Global increase in CO2 |
2) and 3) |
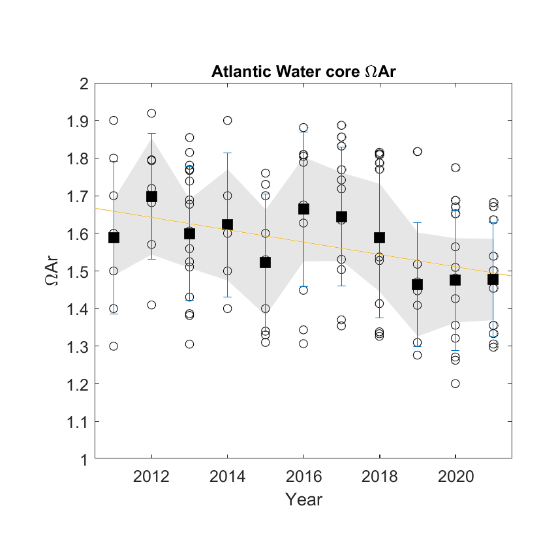
| Aragonite saturation [NwI22] |
Decreasing aragonite saturation [NwP22] |
Global increase in CO2 |
2) and 3) |
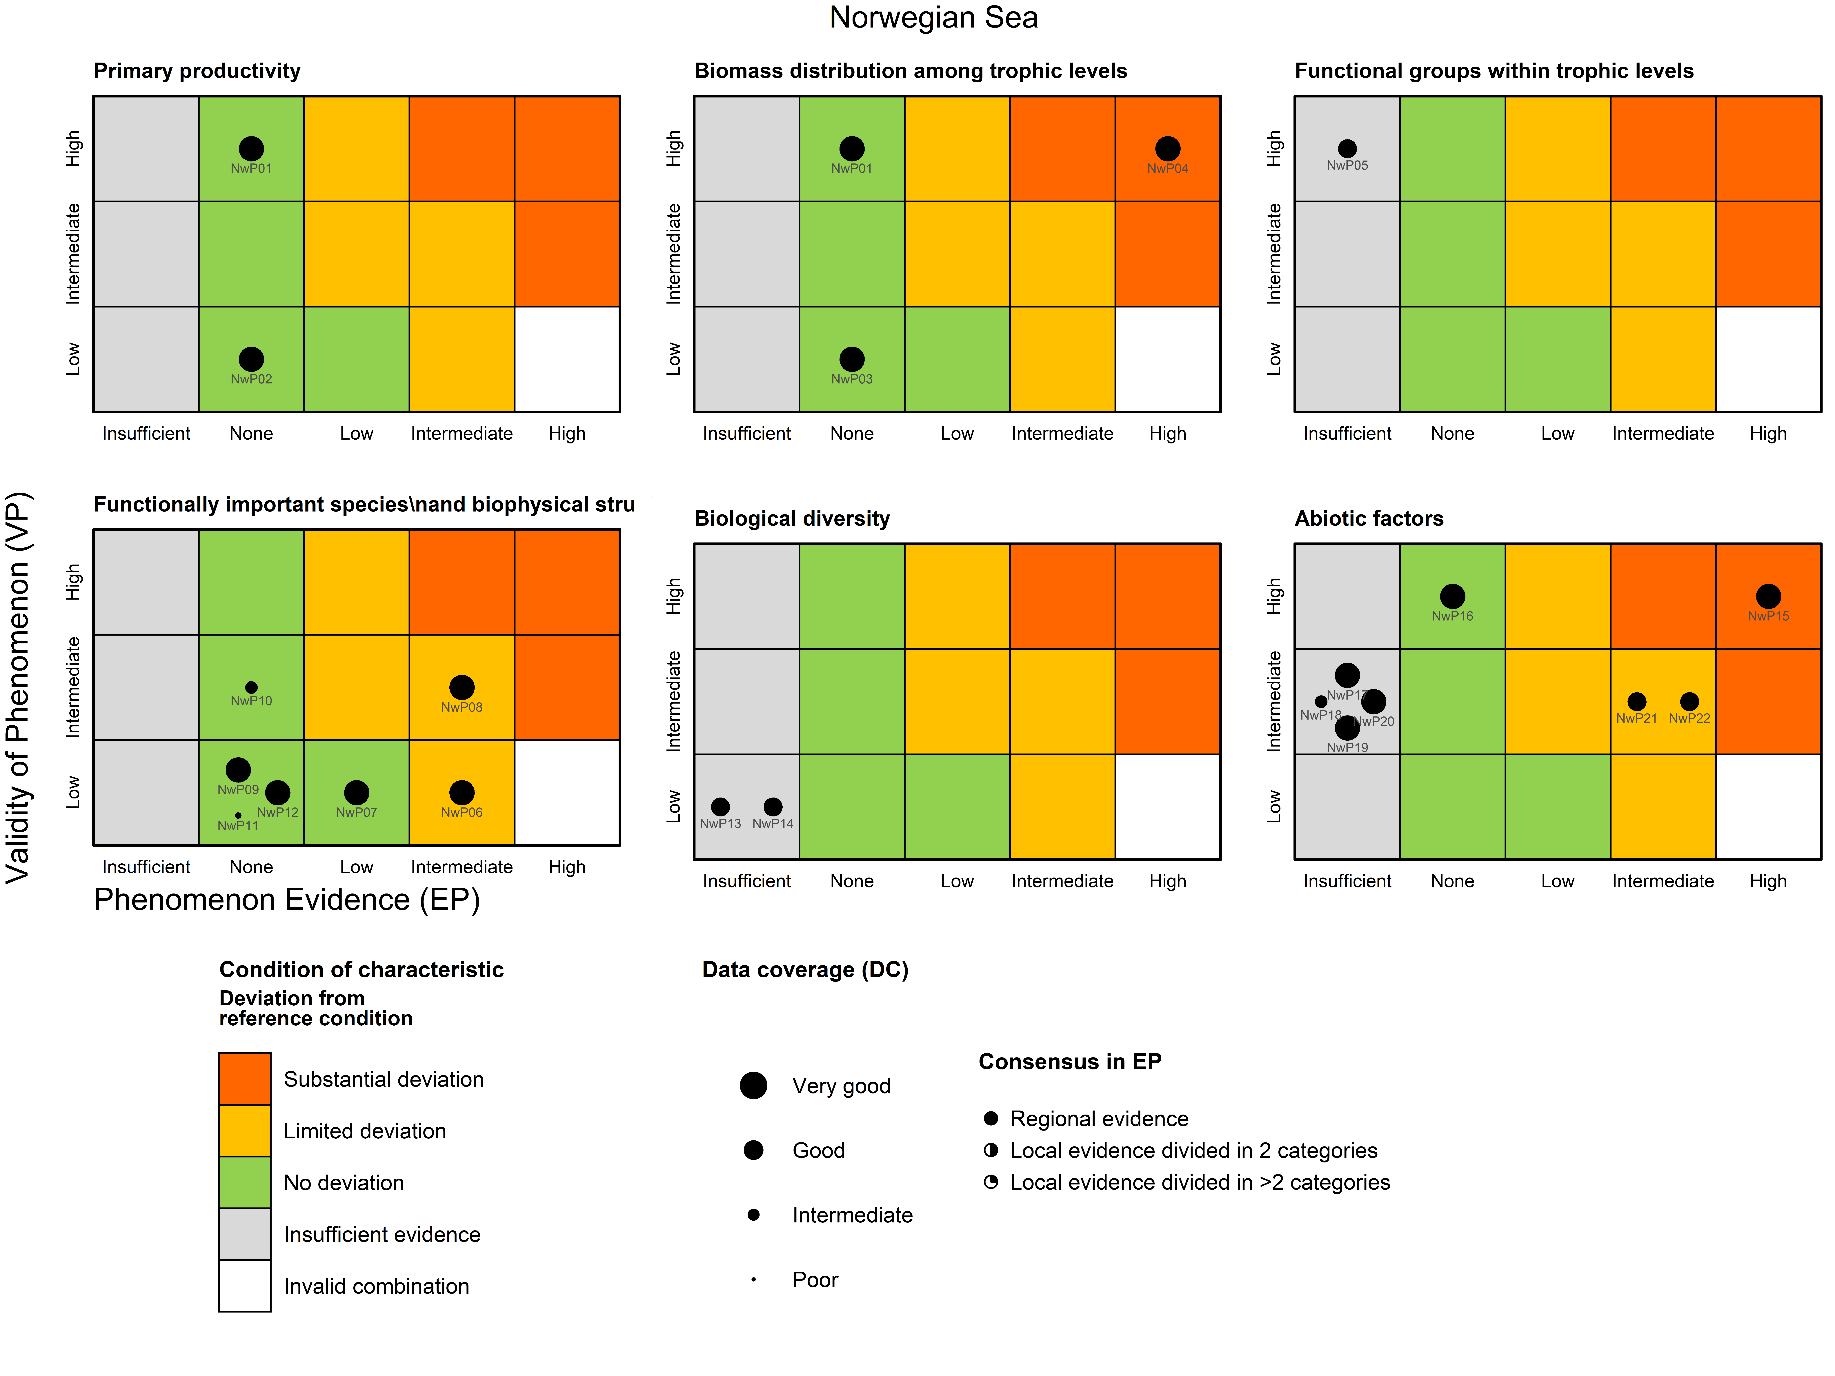
Table 5.1 List of phenomena including overall approach used to determine the extent to which each phenomenon has occurred in the pelagic ecosystem in the Norwegian Sea. Approach refers to methods used to determine the extent to which the phenomenon has occurred. (1) For quantitative phenomena: The values of the indicator relative to an estimated quantitative threshold value (category not used in the current assessment) (2) For qualitative phenomena: The value of the indicator relative to variation estimated from the indicator time series or other qualitative or quantitative information about a reference state (3) For all phenomena: Observed and expected effects of changes in the indicator on other components of the ecosystem (i.e. ecosystem significance)
5.1 Scientific evidence base for the phenomena in the Norwegian Sea
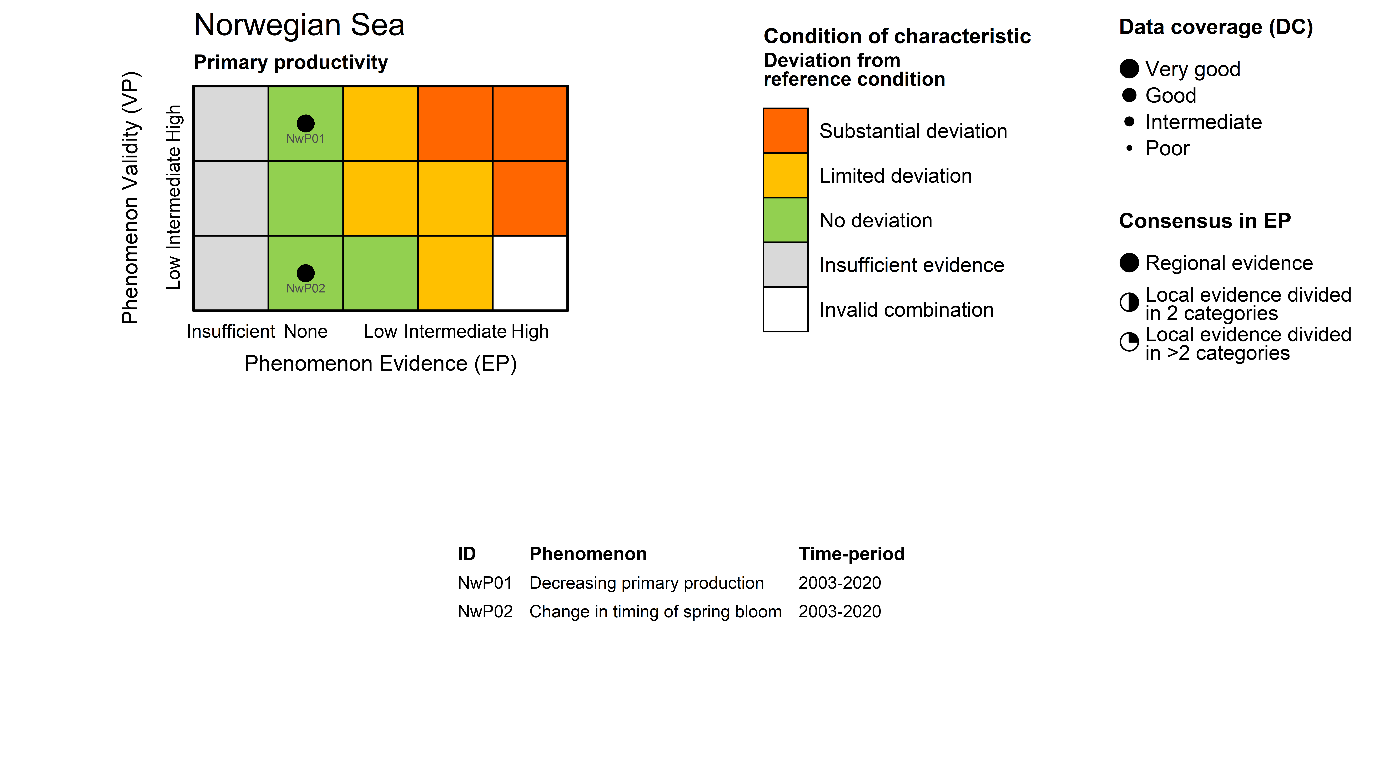
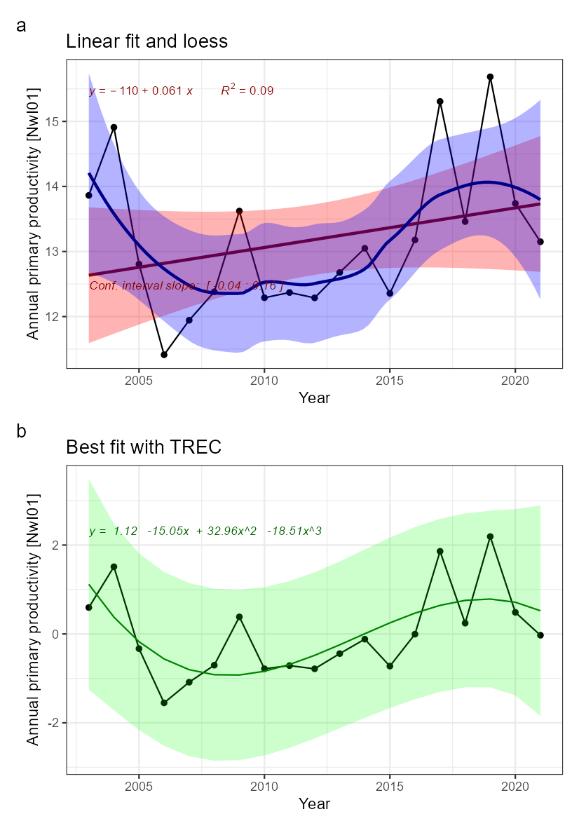
Annual primary productivity [NwI01]
Phenomenon: Decreasing primary production [NwP01]
Ecosystem characteristic: Primary productivity
Under the reference condition annual primary production is high enough to sustain a food web of naturally occurring species. I n winter the surface water mixing is 100 to 200 meters deep in the Norwegian Sea. As insolation increases in spring, primary production increases accordingly, while thermal stratification develops. As described below, climate change is the main driver. In the Norwegian Sea, the mean surface temperature has not increased during the last 100 years, because the region is dominated by circulation and advection of Arctic waters versus Atlantic Waters ��(Xu et al., 2021)�. The present situation in this respect can therefore be assumed to mirror the reference condition.
The most important anthropogenic driver of change in the indicator is climate change. Global warming of surface waters has resulted in a worldwide increased stabilization of stratification and reduction of vertical advection of mineral nutrients to the euphotic zone �����(Yamaguchi and Suga, 2019; Kwiatkowski et al., 2020)�. As described above, mean surface temperature has not increased in the Norwegian Sea during the last 100 years ��(Xu et al., 2021)�. Future warming is expected to result in higher surface temperature, increased stratification and reduced primary production ��(Moore et al., 2018)�. While modelling work for the Norwegian Sea has suggested warming may give a weak increase in primary production �����(Kjesbu et al., 2022)�, the understanding of the link between climate change and change in the indicator is still rated as certain.
Both models and observations show that primary production is generally positively related to fisheries yield �����(Iverson, 1990; Ware and Thomson, 2005; Chassot et al., 2007; Chassot et al., 2010)�, thus providing strong evidence that changes in primary production have substantial impacts on other parts of marine ecosystems. The understanding of the importance of changes in the indicator for the rest of the ecosystem is thus rated as good.
Knowledge gaps include a need for in situ measurements and measurements of the ratio of new to regenerated production. It also includes a need for more information on changes in phytoplankton bloom phenology and the impact of changes in phytoplankton species composition on annual primary production and trophic transfer, as well as high spatial resolution biogeochemical models with high-quality atmospheric forcing which can consider changes in species composition.
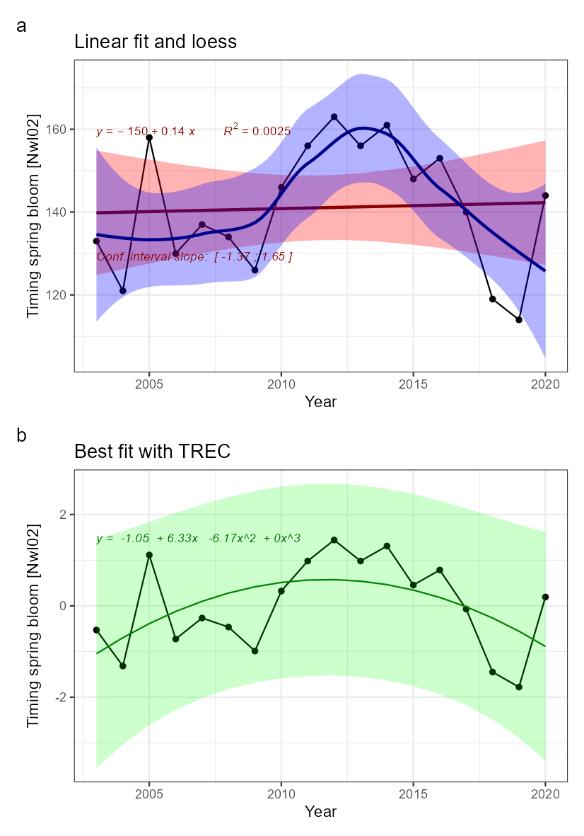
Timing of the spring bloom [NwI02]
Phenomenon: Change in timing of spring bloom [NwP02]
Ecosystem characteristic: Primary productivity
In winter the surface water mixing is 100 to 200 meters deep in the Norwegian Sea and insolation is very low. As insolation increases in spring, primary production increases accordingly, while thermal stratification develops. Spring bloom dynamics are governed by a variety of factors and has been thoroughly reviewed and discussed by ��Lindemann and St. John (2014)�. Insolation, stratification, and grazing are recognized as main drivers of variability, and light and surface water mixing are influenced by cloudiness and storms. Thus, good weather in April and early May is conducive to early spring bloom, but a successful population of grazers may slow the accumulation of phytoplankton biomass. In the literature, the start of the spring bloom has been defined as the point in time when phytoplankton biomass reaches a certain threshold �����(Siegel et al., 2002)�. The biomass accumulation will be a function of both phytoplankton growth and water column stratification, which are influenced by temperature.
The most important anthropogenic driver of change in the indicator is climate change. Increasing sea surface temperature is predicted to stabilize stratification, but on the other hand climate change may increase storminess and influence timing of storms ��(Landgren et al., 2019)�. As the development of future storminess may be harder to predict, the understanding of the link between climate change and the indicator is rated as less certain.
The spring bloom is a major event in temperate marine ecosystems, and the success of many grazers depends on the high food availability at the height of the bloom. Many species have synchronized their spawning with the expected bloom for optimized food conditions. Changes in the timing of spring bloom may have negative consequences for these grazers �����(Edwards and Richardson, 2004; Durant et al., 2019; Yamaguchi et al., 2022)�. In temperate regions of the ocean, global warming has been shown to have influenced the onset of the bloom to earlier dates ��(Racault et al., 2012)�, and this prolongs the growing season. The effect of global warming on temperature has been detectable since the late 1980s, but the start spring bloom in the open ocean can only be precisely determined from the global ocean color satellite programs which started in 1996. The understanding of the importance of changes in the indicator for the ecosystem is rated as less good.
Research is needed to understand and quantify temporal changes and variability in the start of the spring bloom, as well as studies on the impact of climate change on the multiple controls at work ��(Lindemann and St. John, 2014)�. Other knowledge gaps include a need for more in situ measurements, high spatial resolution biogeochemical models, and analysis and interpretation of remote sensing data. Too little is known about the relationship between magnitude of spring bloom timing shift and effects on the ecosystem to evaluate how large changes should be for effects with ecosystem significance to occur.
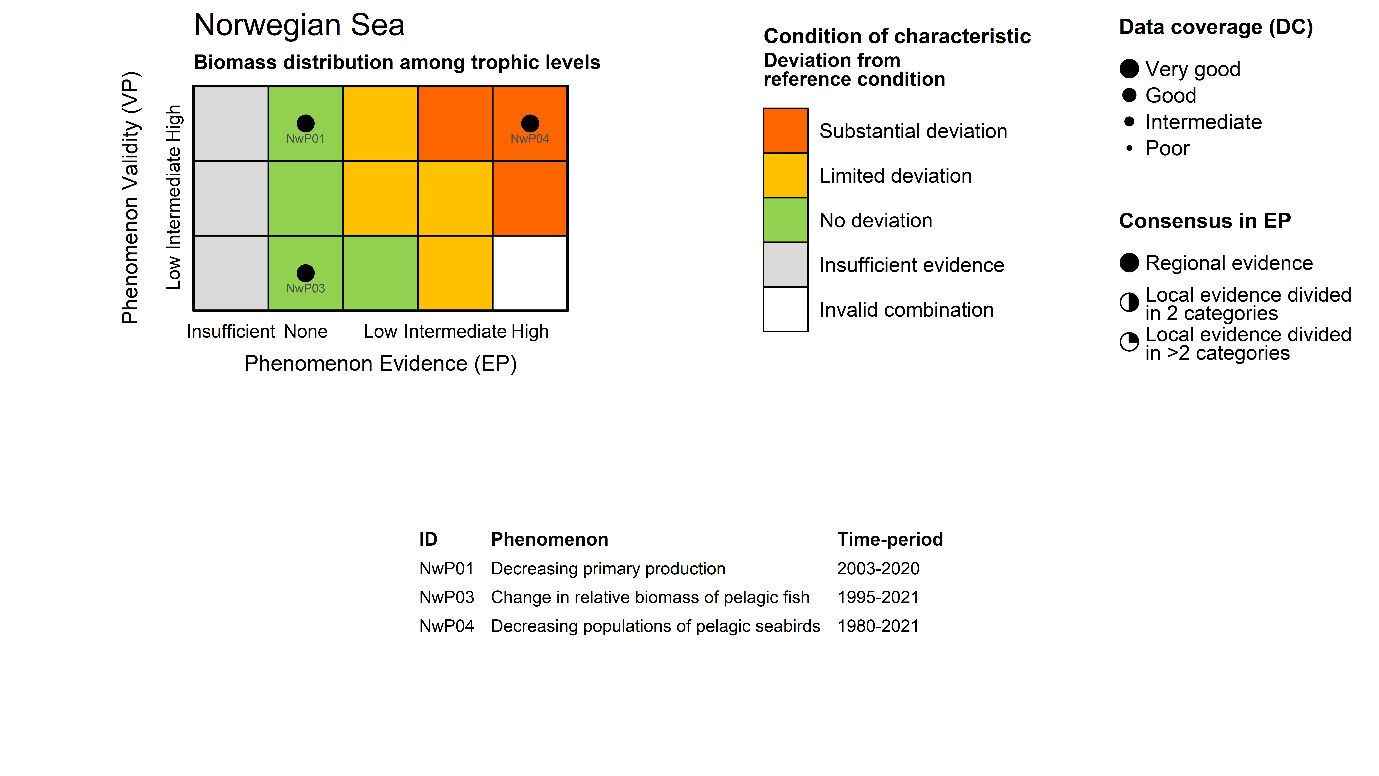
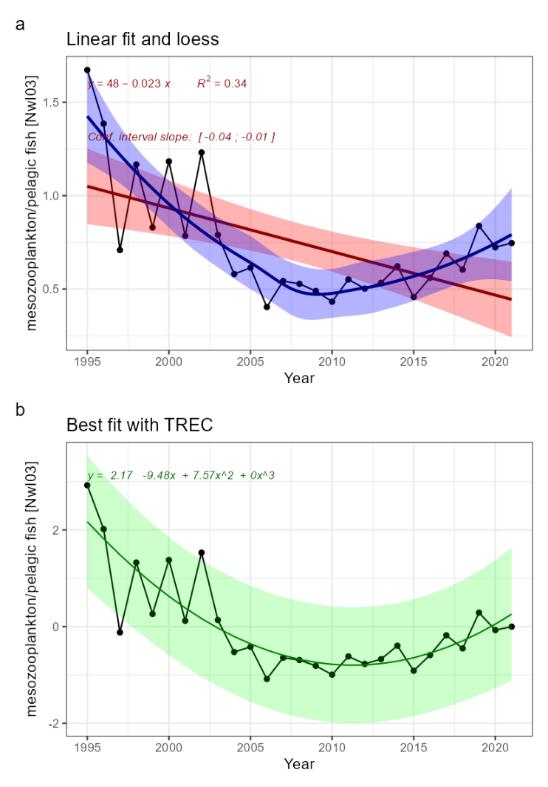
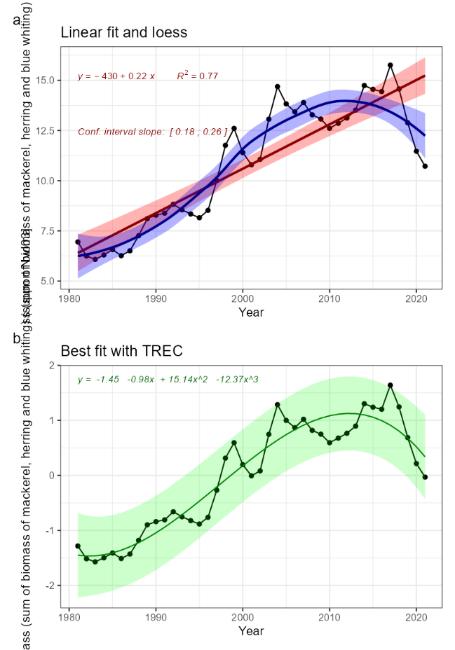
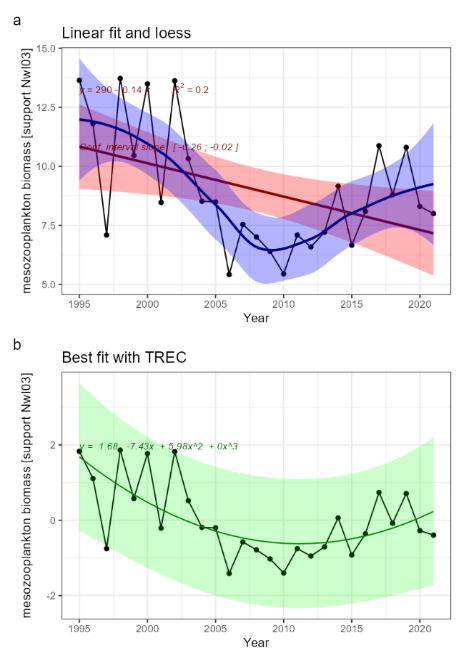
Mesozooplankton biomass relative to pelagic fish biomass [NwI03]
Phenomenon: Change in relative biomass of pelagic fish [NwP03]
Ecosystem characteristic: Biomass distribution among trophic levels
Mesozooplankton and pelagic fish are dominant components of the Norwegian Sea pelagic ecosystem ��(Skjoldal, 2004)�. Mesozooplankton make up a large part of the diet of the three pelagic fish stocks; mackerel, Norwegian spring-spawning herring and blue whiting �����(Dalpadado et al., 2000; Langøy et al., 2012; Bachiller et al., 2016; Mousing et al., Submitted)�. Thus, important aspects of the overall distribution in biomass among trophic levels in the ecosystem can be observed by looking at the biomass of these two groups. While there is limited information about zooplankton and pelagic fish biomass variation under the reference condition in the Norwegian Sea, information do exist for one of the stocks, Norwegian spring-spawning herring (see phenomenon for herring stock size [NwP08]), showing that the size of the stock may vary over nearly an order of magnitude for periods that can be considered descriptive for the reference condition for this stock (i.e., pre WWII, ��Toresen and Østvedt (2000)�). Large variation in stock size has been observed also for mackerel and blue whiting for more recent periods, and although some of this variation can be attributed to fishing, large parts of it is clearly due to variation in recruitment ��(ICES, 2021d; ICES, 2021c; ICES, 2022d)�, which may be more loosely linked to anthropogenic drivers and thus possibly to a large extent represent natural variation (see phenomena on herring recruitment [NwP09], mackerel recruitment [NwP07] and blue whiting recruitment [NwP11]). Related to this, it should be noted that several orders of magnitude variation in stock size has been demonstrated for pelagic fish stocks in other systems under periods of little anthropogenic impact ��(Baumgartner et al., 1992)�. Thus, pelagic fish biomass should be considered to be highly variable under the reference condition. Information on mesozooplankton biomass is more limited compared with what we know about pelagic fish, but estimates from 1995 and onwards from the Norwegian Sea shows that there was a drop of about a third from the mid-2000s to around 2010 linked to reduced inflow of Arctic water and an increase of a similar magnitude linked to increased inflow of Arctic water a decade later ��(Skagseth et al., 2022)�. This suggests that there is considerable natural variation also in mesozooplankton biomass under the reference condition.
The indicator is represented by an index on the ratio of overall biomass of the three pelagic fish stocks to mesozooplankton biomass. The most important anthropogenic driver of change in this indicator is fisheries, with climate change also having a possible role. The link between these drivers and biomass of the three pelagic fish stocks is described in the phenomena for these stocks (phenomena for mackerel stock size [NwP06], herring stock size [NwP08] and blue whiting stock size [NwP10]). In short, fisheries have the potential to cause declines in biomass of all the three stocks, whereas links to climate change are more uncertain. In addition, it should be noted that predation by marine mammals is estimated to be 3 times greater than removals from the fisheries ��(Skern-Mauritzen et al., 2022)�, thus having a potential for introducing considerable natural variation in the indicator. For mesozooplankton biomass, there are indications of a link to inflow of Arctic water to the ecosystem, with increasing inflow causing increased biomass ��(Skagseth et al., 2022)�. While there is a possible link between Arctic water inflow and climate change, there are large uncertainties associated with this (phenomena #Arctic water). There is also a fishery on mesozooplankton, but the quota is small and the effect on the stock is considered to be negligible ��(Broms et al., 2016; Hansen et al., 2021a)�. Although the understanding of the link between fisheries and pelagic fish stock biomass is rated as certain (see phenomena for fish stocks, NwP06, NwP08 and NwP10, i.e., capturing the effects on both pelagic fish and mesozooplankton biomass), is rated as less certain.
The extent to which mesozooplankton affects pelagic fish biomass or vice versa has been subject of several studies. For example, based on negative relationships between fish individual growth and biomass, ��Huse et al. (2012)� suggested that there are clear indications of intra- and interspecific competition over food, that the biomass of pelagic planktivorous fish had been above the carrying capacity in the years preceding the study and that reduction in zooplankton biomass seen in the early 2000s was caused by fish predation. Similarly, based on a study of herring abundance, herring feeding and mesozooplankton abundance, ��Olsen et al. (2007)� suggested that there was a top-down effect from herring on mesozooplankton biomass acting in the western part of the Norwegian Sea. ��Planque et al. (2022)�, on the other hand, quantified trophic interactions in the Norwegian Sea pelagic ecosystem using inverse modelling and found no support for top-down control on planktonic prey biomass and little support for the hypothesised competition for resources between the three small pelagic species. Thus, the knowledge about consequences of change in the indicator for the ecosystem as a whole is rated as less good.
High trophic level seabirds [NwI04]
Phenomenon: Decreasing populations of pelagic seabirds [NwP04]
Ecosystem characteristic: Biomass distribution among trophic levels
Under the reference condition, large breeding colonies hosting around 1.8 million breeding pairs of pelagic seabirds are found along the outer Norwegian coast bordering the Norwegian Sea. This rich pelagic seabird community is dominated by Atlantic puffin (Fratercula arctica) followed by black-legged kittiwake (Rissa tridactyla) and common guillemot (Uria aalge) ��(Brun, 1979)�. ��Fauchald et al. (2015)� estimated the total population of these species to about 1.8 mill. pairs in 1980. The populations of puffin and common murre declined while the population of kittiwake increased during the 1970s ��(Brun, 1979)�, and assuming that populations of other pelagic seabirds is negligible, a conservative reference abundance (“pre-industrial” level) of pelagic seabirds in the eastern Norwegian Sea is about 1.8 - 2 mill. breeding pairs. Other pelagic seabirds that breed in the area include Northern fulmar (Fulmarus glacialis), European storm petrel (Hydrobates pelagicus), Leach's storm petrel (Hydrobates leucorhous), Northern gannet (Morus bassanus), great skua (Stercorarius skua), Arctic skua (Stercorarius parasiticus) and razorbill (Alca torda). Combined, these species counted around 20,000 breeding pairs, or about 3% of the pelagic seabirds in the eastern Norwegian Sea in an estimate from 2015 ��(Anker-Nilssen et al., 2015)�. Due to lack of monitoring they are excluded from the present analyses. The major food resource supporting the large colonies of pelagic seabirds in the eastern Norwegian Sea is juvenile fish drifting and residing in the Norwegian coastal current in an area from the spawning sites along the coast to the nursery and feeding areas in the Norwegian and Barents Seas �����(Anker-Nilssen, 1992; Sætre et al., 2002; Durant et al., 2003; Sandvik et al., 2016)�. Most notably, the pelagic seabirds prey upon juveniles of the large pelagic fish stocks inhabiting the Norwegian and Barents Seas, including the Norwegian spring spawning (NSS) herring stock (Clupea harengus) and the stocks of Northeast Arctic (NEA) saithe (Pollachius virens), haddock (Melanogrammus aeglefinus) and cod (Gadus morhua) �����(Anker-Nilssen, 1987; Anker-Nilssen and Øyan, 1995; Barrett et al., 2002; Anker-Nilssen and Aarvak, 2006)�. In addition, local stocks of sandeels (Ammodytes spp.) are important ��(Anker-Nilssen and Aarvak, 2006; Christensen-Dalsgaard et al., 2018)�. These food resources are seasonal with a peak in availability during spring and summer. Accordingly, pelagic seabirds are mainly present in the eastern part of the Norwegian Sea during pre-breeding and breeding (March-July), while they are mostly absent during autumn and winter ��(Fauchald et al., 2021)�.
The most important anthropogenic drivers of change in this indicator are fisheries and climate change. Following overfishing in the 1960s, the collapse of the NSS herring in 1970 ��(Dragesund et al., 2008)� resulted in a series of years with low spawning output, low abundance of 0-group herring, and as a consequence, breeding failures and subsequent population declines in Atlantic puffin as well as other pelagic seabirds �����(Anker-Nilssen and Øyan, 1995; Sætre et al., 2002; Anker-Nilssen and Aarvak, 2006; Cury et al., 2011)�. The link between overfishing and the indicator is well documented in the Norwegian Sea (ibid.) and similar impacts have been described elsewhere �����(Cury et al., 2011; Grémillet et al., 2018)�. In addition to overfishing, climate change affects the seabird populations in a number of more indirect and subtle ways. Importantly, climate change impacts the timing and location of fish spawning and the subsequent production, distribution and survival of juvenile fish. As a result, the fine-tuned interrelationship between the availability of 0-group fish and the breeding cycle of seabirds is disrupted, causing a mismatch between prey availability and seabird reproduction �����(Durant et al., 2003; Durant et al., 2004)�. Rapid climate change does therefore negatively affect the productivity of pelagic seabirds breeding in colonies bordering the Norwegian Sea, and this mechanism is partly responsible for the current decline in the populations �����(Durant et al., 2003)�. The link between climate change and the indicator is well documented in the Norwegian Sea (ibid.) and similar impacts have been described elsewhere (see e.g., �����Piatt et al. (2020); Hansen et al. (2021b)�). The understanding of the link between the indicator and fisheries and climate change is assessed as certain.
Atlantic puffin, black-legged kittiwake and common guillemot are, together with marine mammals and predatory fish, important predators on juvenile and pelagic fish and constitute a significant part of the top predator guild in the eastern part of the Norwegian Sea ��(Sætre et al., 2002; Skjoldal, 2004)�. A large relative drop in the abundance of these species could impact their role as top predators in the ecosystem and would signal negative changes at lower trophic levels. The understanding of the importance of changes in the abundance of pelagic seabirds is assessed as good.
Decreasing abundance of pelagic seabirds can be considered of ecosystem significance if, for example i) there is a sudden drop in the populations caused by a mass die-off of birds following a collapse in the availability of prey due to climate extremes or overfishing, ii) there is a significant gradual long-term (> 10 years) decrease in the populations associated with climate warming and/or decrease in the availability of prey.
Monitoring and research have highlighted the impacts of overfishing and climate change on seabird populations dynamics in the eastern Norwegian Sea. It is, however, difficult to discern the relative importance of the different drivers. Moreover, the negative impact of predation from a growing population of white-tailed eagles has probably also contributed to the decline in the populations of black-legged kittiwakes and common guillemots in the eastern Norwegian Sea ��(Hipfner et al., 2012)�.
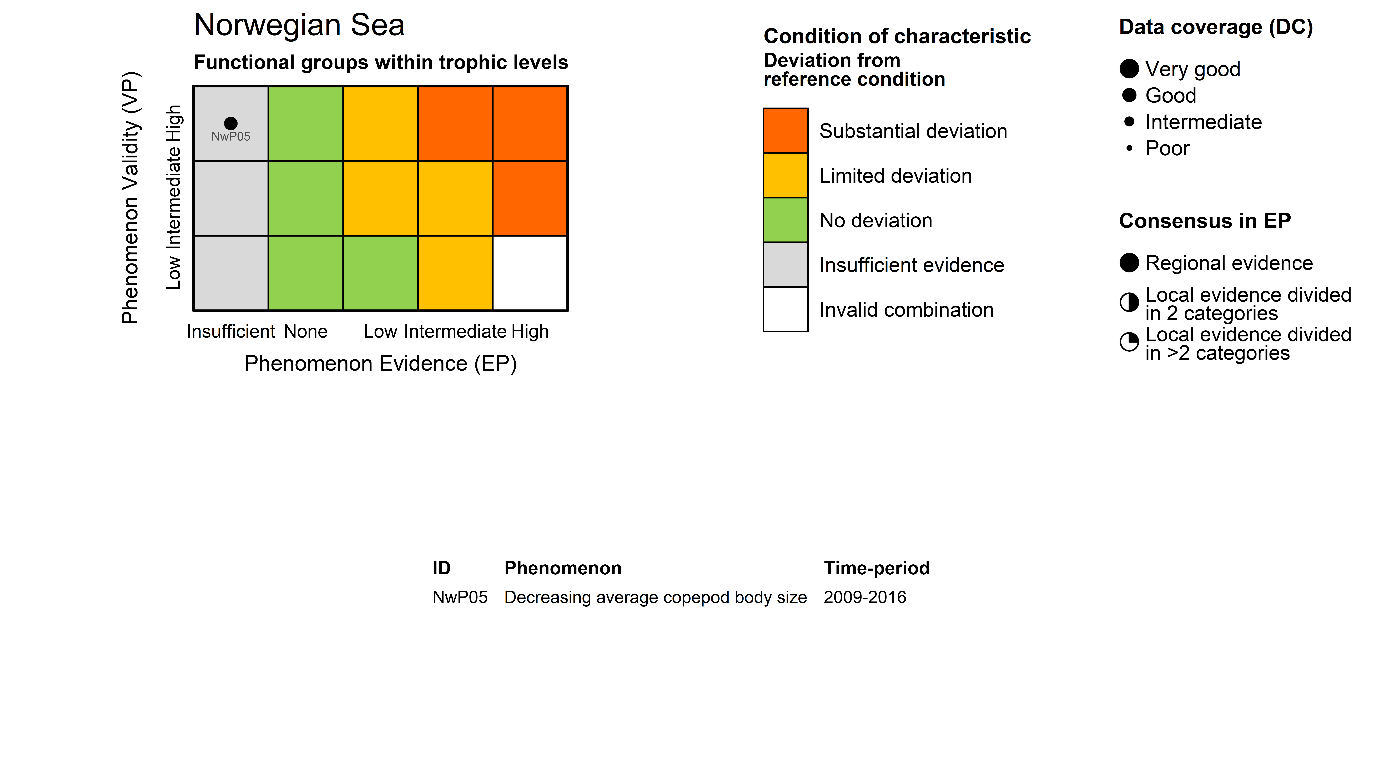
Copepod body size [NwI05]
Phenomenon: Decreasing average copepod body size [NwP05]
Ecosystem characteristic: Functional groups within trophic levels
Under the reference condition, copepod body size is considered as a key trait in zooplankton as it is related to numerous physiological and ecological processes, e.g., individual growth, metabolic rates, feeding behavior and life history strategies �����(Pope et al., 1995; Kiørboe, 2011; McGinty et al., 2021)�. In planktonic communities, body size is of particular importance, because food webs are comprised of regular and progressively increasing size spectra ��(Sheldon et al., 1972)�. Copepod b ody size is affecting grazing efficiency, predator prey interactions, and trophic energy transfer and thereby determining the trophic structure and dynamics of pelagic communities �� (Gorokhova et al., 2013). Zooplankton body size varies with latitude and species tend to be larger in colder, higher latitudes compared to its congeners found in warmer regions (Bergmann's temperature-size rule).
The most important anthropogenic driver of change in zooplankton body size is climate change, in terms of increasing temperature. Higher temperatures cause elevated metabolic rates and energy costs, resulting in smaller body sizes both within species ��(Record et al., 2012)� as well as at the community level ��(Beaugrand et al., 2002b)�. Ecological theory and observations suggest that climate warming is expected to favor small copepods over large copepods �����(Daufresne et al., 2009)�. This suggests that an increase in temperature should result in a decrease in the proportion of larger-sized individuals and species in a community.
As ocean temperatures increase over the next century, these changes are likely to shift communities into states where smaller phytoplankton and zooplankton species dominate. Significant shifts in zooplankton community structure and size-spectra towards the dominance of the small-sized copepod Oithona similis relative to large-bodied calanoid copepods have already been observed across the global ocean such as in the Arctic ��(Balazy et al., 2021)�, the North Sea �����(Nielsen and Sabatini, 1996; Bedford et al., 2018)�, the North Atlantic and the Mediterranean Sea �����(Beaugrand et al., 2003; Goberville et al., 2014; Castellani et al., 2015)�.
The replacement of large copepods with small ones has also been suggested as an indicator of eutrophication in the Baltic region ��(Gorokhova et al., 2013; HELCOM, 2018)� but in marine systems the causal link between eutrophication and body size is ambiguous ��(Ndah et al., 2022)�.
Given the solid evidence described above the understanding of the link between temperature and zooplankton body size is rated as certain.
Changes in the average copepod body size are expected to alter the food web structure and the carbon transfer between trophic levels. Zooplankton communities composed of large-bodied copepods have a higher capacity for transfer of energy from primary producers (phytoplankton) to fish, i.e., higher energy transfer efficiency. By contrast, a dominance of small-bodied copepods is usually associated with lower energy transfer efficiency, due to higher losses ��(Lewandowska and Sommer, 2010)�. Thus, a reduction in the mean copepod body size represents unfavorable fish feeding conditions and less efficient utilization of primary production. According to ecological theories, this would represent a less efficient food web ��(HELCOM, 2018)�.
As ocean temperatures increase over the next century, these changes are likely to shift communities into states where smaller phytoplankton and zooplankton species dominate. This will result in a less productive system, with decreased trophic efficiency and reduced fecal carbon flux ��(Hébert et al., 2016)�.
A reduction in the zooplankton body size will have direct negative impact on fish feeding conditions, fish larval survival and recruitment ��(Beaugrand, 2005; Pitois et al., 2012)�. ��Pitois et al. (2021)� found strong correlations between herring distribution and larger copepod mean sizes rather than high copepod abundances, confirming that copepod mean size has the potential to reflect food web and ecosystem health status as well as highlight climatic impacts on marine ecosystems. In the Norwegian Sea the herring selected the larger copepodite stages and adults of C. finmarchicus and C. hyperboreus during its feeding migration (Dalpapado et al. 2000).
Given the substantial evidence described above the understanding of the importance of change in the indicator for other parts of the ecosystem is rated as good.
Decreasing zooplankton body size can be considered of ecosystem significance if i) it causes massive declines in the production and recruitment of fish stocks, and ii) it causes reduced vertical carbon flux (carbon pump).
Knowledge gaps in monitoring and research: In the CPR data set, copepods are classified into two size groups: as Small” (< 2 mm) and “Large” (2> mm). However, dataset including species specific copepod sizes are available ��(Razouls et al., 2005-2022; Brun et al., 2017)�.
The interpretation of this phenomenon may be demanding due to top-down effects. Size-selective predation on zooplankton by predators (top-down) will affect the size composition of zooplankton and may counteract climate -induced effects (bottom-up). Future studies should try to disentangle the interaction between top-down and bottom-up control.
Alternative metrics related to copepod size should be investigated further, e.g., “Copepod community body size” as the abundance weighted mean prosome length ��(Evans et al., 2020)�. R elative metrics, including both size and abundance may be more informative, e.g. Normalized Biomass Size-Spectra (NBSS) and the Abundance-Size Spectrum of zooplankton, referring to the relative abundance or biomass of zooplankton organisms of different size classes ��(Thompson et al., 2013)�.
The MSTS (Zooplankton Mean Size and Total Stock) is a core indicator in the Baltic region, where the lengths of individuals are measured for each species ��(HELCOM, 2018)�. A similar indicator exists in the OSPAR area (FW6; ��Ndah et al. (2022)�). However, a major limitation is that zooplankton sizes are not regularly measured in marine monitoring and are usually estimated using mean values from the literature. The lack of in-situ size information will mask any potential long-term change in species-specific size structure. Future monitoring should aim at including size measurements of zooplankton, by the use of laboratory image analyzing methods (e.g., FlowCam) or, preferably, by in situ methods (e.g., VPR).
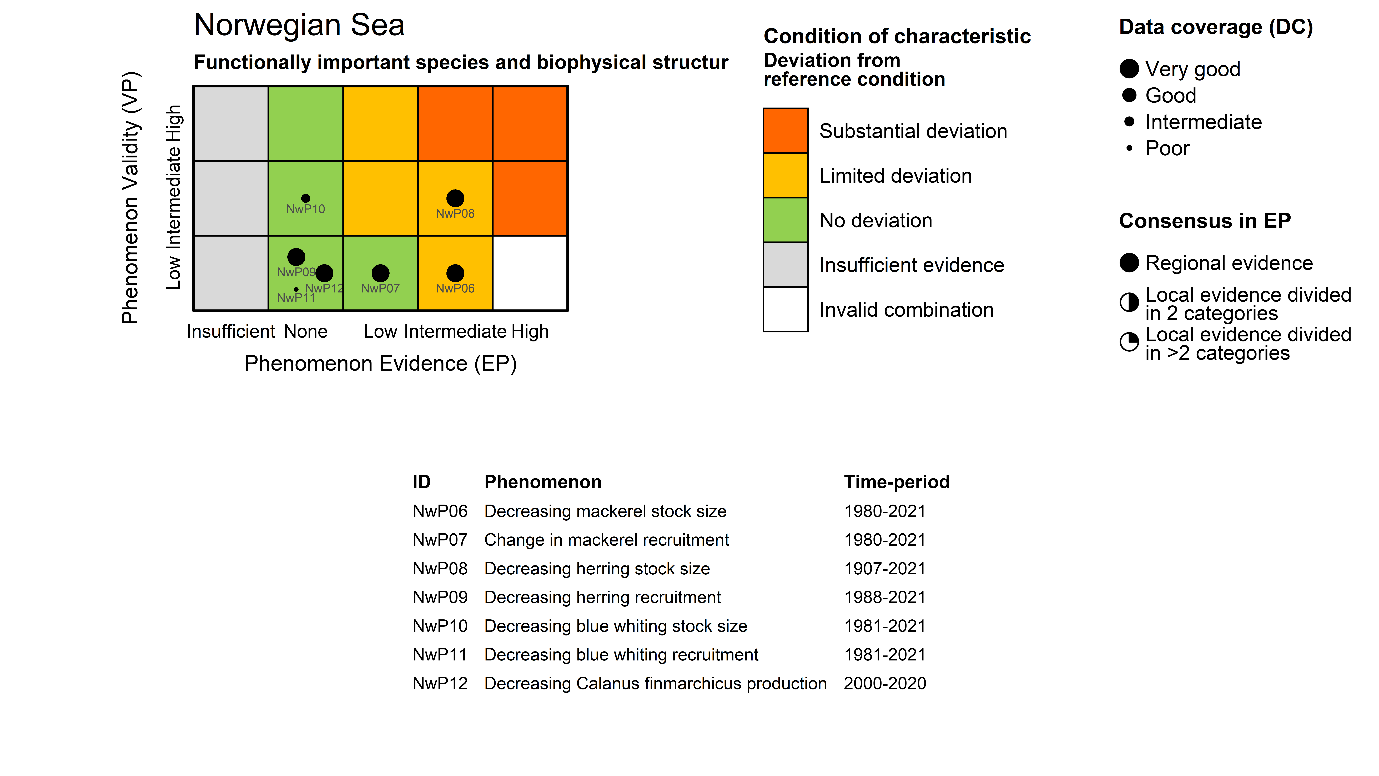
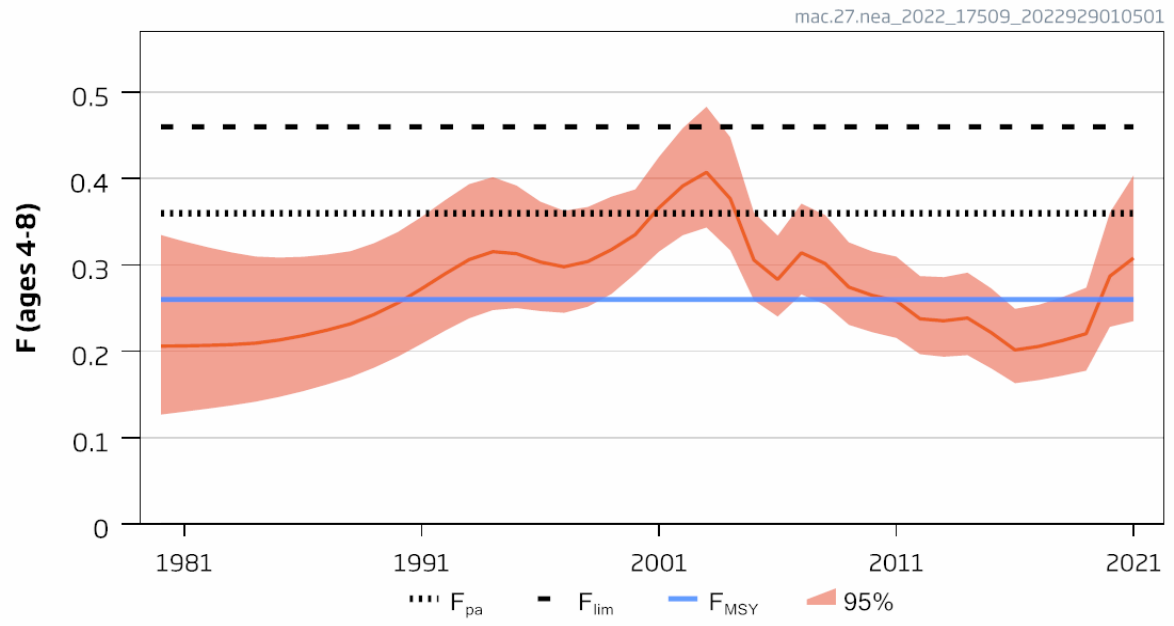
Mackerel stock size [NwI06]
Phenomenon: Decreasing mackerel stock size [NwP06]
Ecosystem characteristic: Functionally important species and biophysical structures
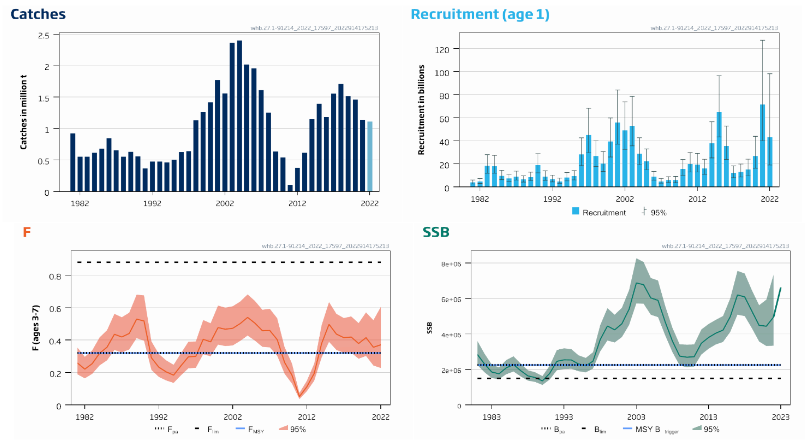
Under the reference condition, the mackerel stock is one of the largest pelagic stocks in the Norwegian Sea, which is its main feeding area. Over the last 100 years, the perception of the NEA mackerel stock structure and migration patterns has changed considerably ��(Iversen, 2002)�. For a long time, the stock was assumed to consist of three populations with distinct migration patterns: Southern, Western and North Sea ��(Iversen, 2002)�. However, recent studies indicated no clear evidence of structuring within the populations �����(Jansen, 2013; Jansen and Gislason, 2013; Gíslason et al., 2020)�, but rather suggested that the stock is a single population with a dynamic migration pattern, spawning over a large area from the coast of Portugal to the North Sea ��(Brunel et al., 2017; ICES, 2019b)�; feeding in North-Sea, Norwegian Sea and adjacent areas �� (Nøttestad et al., 2016) � and wintering around Shetland ��(Jansen et al., 2012)�. Since around 2005, the stock has experienced changes in growth, condition, and distribution pattern associated with an increase in recruitment and spawning stock biomass �����(Jansen et al., 2015; Olafsdottir et al., 2015; Nøttestad et al., 2016; ICES, 2021b)�. Such dynamics in the distribution of a commercially important stock extending over different exclusive economic zones (EEZs) is clearly a challenge for an effective management ��(Baudron et al., 2020)�. Hence, considerable research efforts have been put into understanding the reasons behind observed changes, both regarding the spawning �����(Bruge et al., 2016; Brunel et al., 2017; dos Santos Schmidt et al., In prep.)�, feeding �����(Astthorsson et al., 2012; Jansen et al., 2016; Pacariz et al., 2016; Nikolioudakis et al., 2018; Olafsdottir et al., 2019)����, and wintering distribution ��(Jansen et al., 2012)�. This includes attempts to develop new modeling approaches to study mackerel migrations �����(Heinänen et al., 2018; Boyd et al., 2020; Payne et al., 2022)�. The general conclusion from these studies is that the observed changes in distributions are driven by both the density dependent effects of changes in size of the stock as well as oceanographic, environmental, and ecological dynamics. In addition, recent research reveal that the NEA mackerel is highly dependent on its energetic status and feed heavily during the spawning period ��(Jansen et al., 2021)�, which ultimately may have significant influence on migration choices during spawning, and between spawning and feeding areas, for a large population under strict competition for prey. Furthermore, a new large scale tagging program have shown that the mackerel undertake size dependent spawning and feeding migrations with the wintering area in Northern North Sea as basis, and that recruits growing up in the North Sea migrates out of the area to feed far west into Icelandic Waters and spawn west of British Isles and farther south as they grow older and larger ��(ICES, 2021b; Ono et al., 2022)�. This suggest that any fidelity for a mackerel growing up in the North Sea or other nursery areas to maintain spawning there is low. Furthermore, one should expect that any dynamics in growth and condition, which typically fluctuates with stock size ��(Olafsdottir et al., 2015)�, may be an important driver for the migration and distribution of the stock.
The most important anthropogenic drivers of change in abundance of mackerel as a whole, and therefore also for the abundance in the Norwegian Sea feeding area, are fisheries and climate change. Under the recent condition with warming of NEA waters from 2000 onwards �����(Asbjørnsen et al., 2020; ICES, 2021c; Kjesbu et al., 2022)�, the NEA mackerel has had series of large year classes leading to high stock levels ��(ICES, 2021b)�, but at the same time the fishing pressure has been high with overshooting quotas around 40% since 2010. Under the continuous high fishing pressure with no large recent year classes this has ultimately led to the decreasing stock size after 2014. Our understanding of the link between fisheries and changes in the stock size inside the Norwegian Sea is therefore rated as certain, whereas the link to climate change and recruitment variation leading to more mackerel in the Norwegian Sea as well as the actual dynamics in distribution inside the area is less certain, i.e. although, as described above, scientists do agree that there are climate effects, there is still need for more research to understand actual underlying processes.
Decreasing stock size of mackerel feeding in the Norwegian Sea area would potentially affect the ecosystem. The diet and consumption of mackerel in the area is well known to overlap with the other larger fish stocks in the area Norwegian spring spawning herring and blue whiting �����(Bachiller et al., 2016; Bachiller et al., 2018)�, and it has been proposed that mackerel may interact with the other two stocks due to competition for prey, and that there may be top-down effects on zooplankton levels ��(Huse et al., 2012)�. Still, it is not confirmed yet that decreasing mackerel stock may have positive effects on the other pelagic fish stocks, or if bottom-up effects are more important for the dynamics. Salmon is another species proposed to potentially suffer from competition with mackerel overlapping during feeding in Norwegian Sea, but recent research have concluded that there is little evidence for this hypothesis ��(Utne et al., 2021)�. Instead it is suggested that the salmon is suffering from bottom-up effects and ecological regime shifts leading to changes in zooplankton availability �����(Utne et al., 2021; Vollset et al., 2022)�. In the North Sea region mackerel has been proved to feed heavily on 0-1 group of various fishes ��(ICES, 1997)�, whereas fish is a minor part of the diet in the Norwegian Sea as a whole as this is not a nursery area for fish in general (Bachiller 2016). However, when mackerel enters the more coastal areas off Norway it demonstrated that it potentially may wipe out local abundance of herring larvae when overlapping in time and space, but the effect on total recruitment is not known �����(Skaret et al., 2015; Allan et al., 2021)�. To sum up, our understanding of the importance of change in the indicator for other parts of the system is therefore rated as less good.
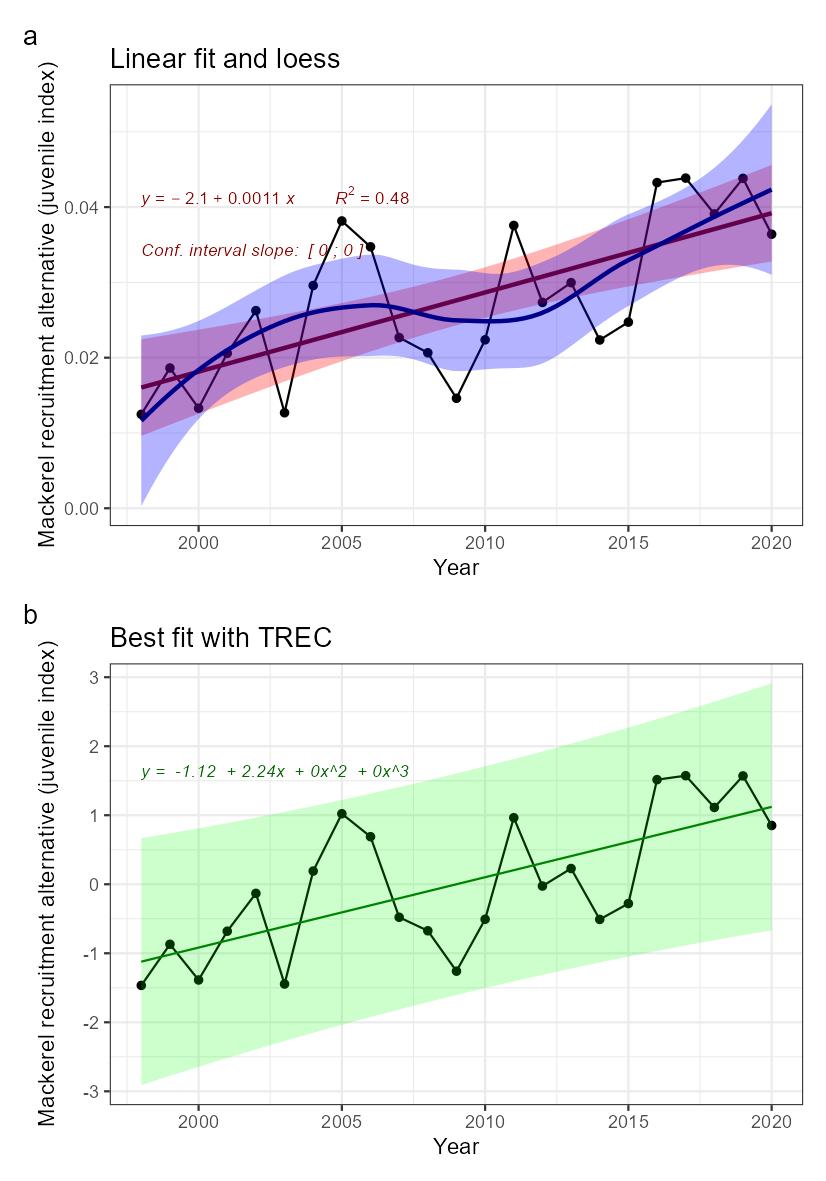
Mackerel recruitment [NwI07]
Phenomenon: Change in mackerel recruitment [NwP07]
Ecosystem characteristic: Functionally important species and biophysical structures
Following the argumentation for decreasing stock size above, decreasing recruitment of mackerel into the Norwegian Sea is also directly linked to the changes in the total stock.
The most important anthropogenic drivers in the indicator are fisheries and climate change. The effect of fisheries as a whole is reduced stock, and there is a relation between stock size and recruitment. More spawners produce more eggs, but also expanding distribution that ultimately may affect survival of progeny ��(ICES, 2019b; ICES, 2021b)�, so drivers affecting the stock size also indirectly affect the recruitment. Under the recent condition with warming of NEA waters from 2000 onwards �����(Asbjørnsen et al., 2020; ICES, 2021c; Kjesbu et al., 2022)�, the NEA mackerel has had series of large year classes. This has happened simultaneously with a north and westward shift in spawning �����(Brunel et al., 2017; ICES, 2019b; dos Santos Schmidt et al., In prep.)� towards Iceland and the Norwegian Sea respectively, which ultimately also has led to more progeny ending up in the Norwegian Sea area visible as 1-2 year olds in the international trawl survey ��(Nøttestad et al., 2021)�. It is uncertain whether the shift in spawning areas is related to temperature ��(Brunel et al., 2017)�, or more related to migration potential following the size structure and condition of the stock as such and the need for feeding while spawning ��(Jansen et al., 2012)�. Both factors may play a role. It is also uncertain whether the more north-western spawning also has resulted in higher survival due to improved environmental conditions for progeny, which indirectly leads to more recruits in the Norwegian Sea area. In conclusion the knowledge about effects of fisheries and climate change for recruitment of mackerel into the Norwegian Sea is regarded less certain.
When interpreting potential ecosystem effects of decreasing recruitment into the Norwegian Sea, i.e., fewer young fish ages 1-2, the geographic distribution is to be taken into account. Here it is evident that the youngest fish is found more south and centrally or closer to Norwegian coast than the older fish ��(Nøttestad et al., 2021; Bjørdal et al., 2022)�, presumably due to reduced migration potential ��(Ono et al., 2022)� and the fact that recruits feed closer to their nursery areas ��(Bjørdal et al., 2022)�. So, any ecosystem effect of large new year classes in the area would not have an impact over large areas prior to reaching the adult stages. With regard to diet and consumption the knowledge for recruits relative to adults is that they have similar diet ��(ICES, 1997; Bjørdal et al., 2022)�. So, the knowledge on potential effects on the ecosystem is similar described above for the total stock. The conclusion is that there is no quantitative evidence of actual ecosystem effects of decreasing abundance of recruits in the area, although this potentially may be the case. Hence, the impact of the indicator recruitment in the Norwegian Sea is rated as less good.
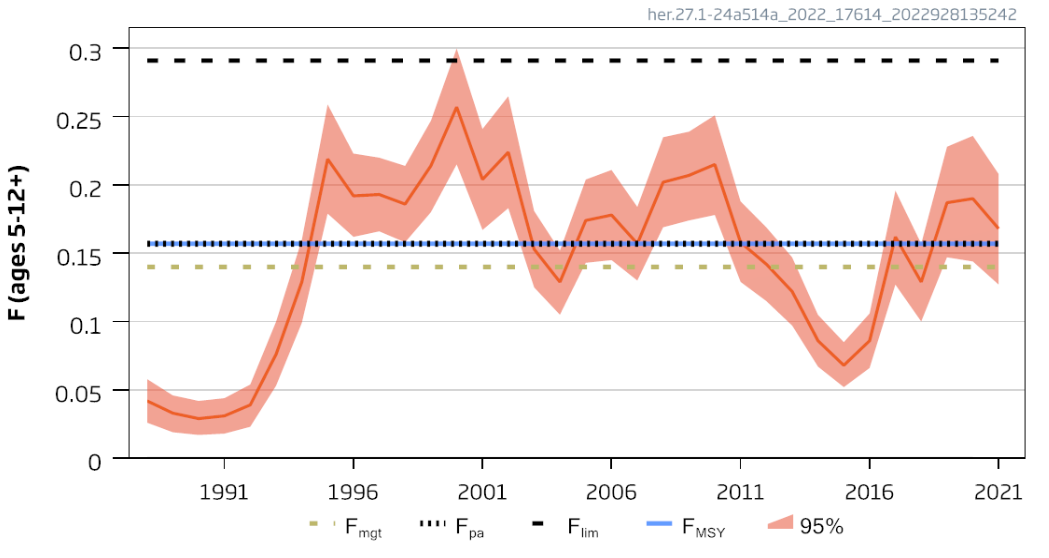
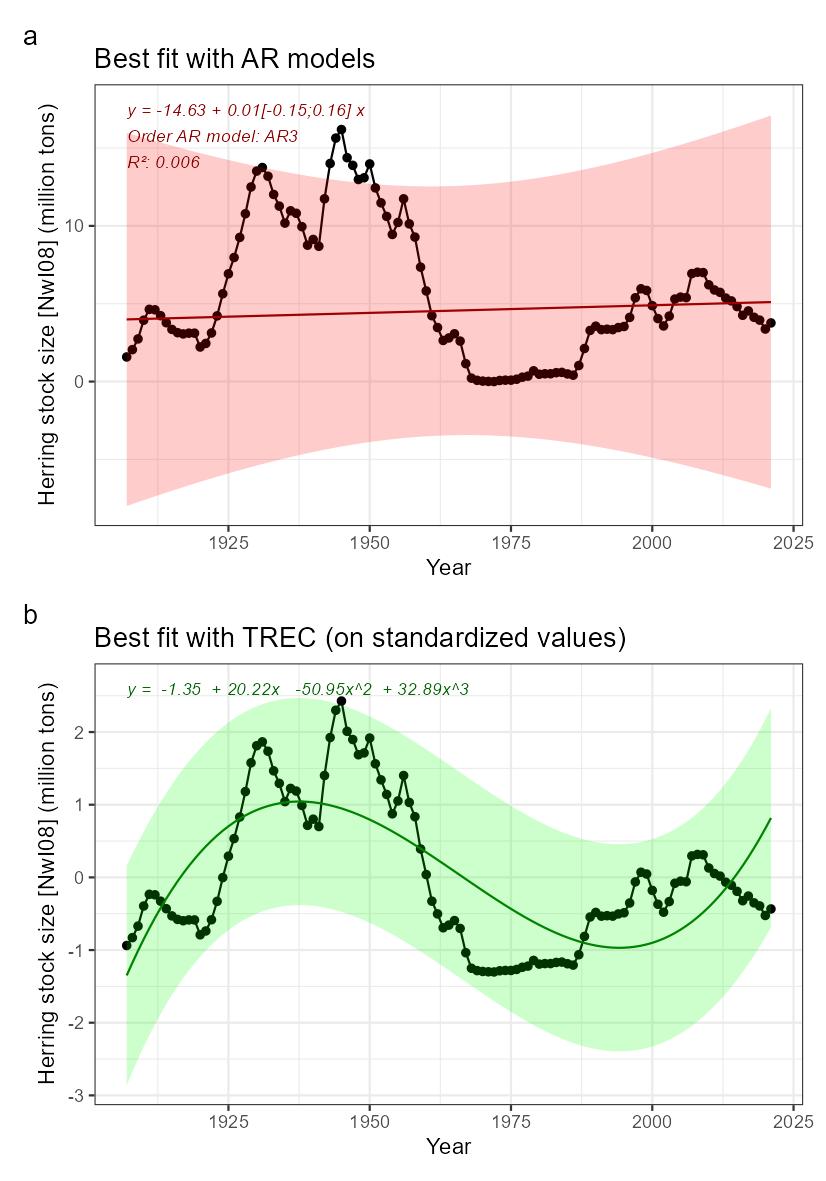
NSS herring stock size [NwI08]
Phenomenon: Decreasing herring stock size [NwP08]
Ecosystem characteristic: Functionally important species and biophysical structures
Under the reference condition, Norwegian spring spawning herring (NSSH, Clupea harengus) is one of the large pelagic fish stocks in the Norwegian Sea ��(Skjoldal, 2004)�. Spawning occurs along the Norwegian coast and larvae drift with the Norwegian coastal current into the Barents Sea where they stay till age 3-4 years, before migrating to the Norwegian Sea and join the adult stock there. After spawning in spring, the adult stock migrates into the Norwegian Sea to feed. Overwintering occurs in fjords or close to the coast in northern Norway. NSSH is an important predator of zooplankton, with the calanoid copepods (especially Calanus finmarchicus) as a dominant prey item �����(Dalpadado et al., 2000; Bachiller et al., 2016)�. It is itself an important prey species for marine mammals ��(Skern-Mauritzen et al., 2022)�, cod, saithe and other demersal species, in addition to seabirds ��(Holst et al., 2004)�. The population dynamics of the NSSH is highly influenced by the recruitment dynamics which is characterized by infrequent strong year classes �����(Fiksen and Slotte, 2002; Sætre et al., 2002; Skagseth et al., 2015; Huse, 2016)�. NSSH is one of the few species across all Norwegian ecosystems for which there are robust data on population size and variation under the reference condition. The period prior to 1945 can be considered representative for the reference condition as fishing mortality was at a low level and likely not significantly influencing stock size ��(Toresen and Østvedt, 2000)�. Data on the stock has been collected since 1907, and virtual population analyses suggests that stock size varied between 2 and 16 million tons between 1907 and 1945 ��(Toresen and Østvedt, 2000)�.
The most important anthropogenic driver of change in this indicator is fisheries. Because of implementation of new fishing technology, fishing mortality increased to high levels in the 20 years following 1945, resulting in serious overfishing and collapse of the stock in the late 1960’ies, when the estimated stock size had declined to 0.05 million tons �����(Dragesund, 1970; Toresen and Østvedt, 2000)�. Thus, without proper management, fisheries have a potential to cause serious declines in the NSSH stock. Climate change is another anthropogenic driver that should be discussed. An assessment looking at how sensitive NSHH is to impact from climate change based on general life history and ecological interactions as well as climate projections up to 2041, suggests that NSSH will be positively affected by climate change for this period �����(Kjesbu et al., 2022)�. It should be noted that the latter study has not addressed directly climate induced changes in herring prey or predators, such as for example changes in zooplankton species composition, which has been shown to be important for fish stock dynamics in the North Sea ��(Beaugrand et al., 2003)�. This contributes to uncertainty associated with the assessment of a positive impact of near future climate change on NSHH. In addition, several studies indicate that recruitment is affected by temperature, with a dome shaped relationship between the two variables, suggesting an optimal temperature below and above which recruitment is negatively affected �����(Toresen and Østvedt, 2000; Toresen et al., 2019)�, although there are uncertainties with this result ��(Garcia et al., 2020)�. A possible negative effect on NSSH recruitment from future temperature increases would contribute further to the uncertainty of the assessment of a positive effect on the stock, and climate change is therefore not considered as an important driver for near future changes in NSHH stock size here. The understanding of the link between fisheries and NSS herring stock size is rated as certain.
Several studies have addressed the ecological interactions between herring and other components of the Norwegian Sea pelagic ecosystem. The influence of interspecific competition as well as competition with the two other large plankton-feeding pelagic fish stocks, mackerel (Scomber scombrus) and blue whiting (Micromesistius poutassou) has been studied by looking at the relationship between length at age and intraspecific and interspecific biomass of these species. While some evidence of intraspecific competition was found for mackerel, no evidence was seen for competition with the other species, suggesting variation in herring biomass do not have strong effects on mackerel. For blue whiting, strong evidence for interspecific competition was found and the vertical distribution between herring and blue whiting appears to be linked so that herring occurs shallower when the abundance of blue whiting is high, indicating interaction between these species ��(Huse et al., 2012)�. Based on these findings and observations of a decline in zooplankton biomass concurrent with an increase in pelagic fish biomass, it has also been speculated that the reduction in zooplankton biomass was caused by pelagic fish and that the system is subject to top-down control ��(Huse et al., 2012)�. Subsequent modelling work based on the principle of chance and necessity, which allows reconstruction of a large number of possible ecosystem trajectories ��(Planque and Mullon, 2020)� suggest on the other hand that there is some support for bottom-up control, no support of top-down control and weak support for competition between pelagic fish species ��(Planque et al., 2022)�. Results related to mackerel are associated with high degree of uncertainty (ibid.). Based on these partly conflicting results, the understanding of importance of change in NSS herring stock size for other parts of the ecosystem is rated as less good.
While the collapse in the herring stock probably allowed high levels of capelin to be sustained in the Barents Sea for many years �����(Gjøsæter and Bogstad, 1998; Hjermann et al., 2004; Gjøsæter et al., 2009)�, there is no evidence of similarly strong effects on components of the Norwegian Sea ecosystem.
Knowledge gaps: There are several surveys covering the stock at different times of the year, in addition to a tagging program. However, there is no coverage of the stock during the autumn. It has been shown that there is an extension of the feeding into autumn in later years ��(Homrum et al., 2022)�. This study was based on data from the fishery, and a survey coverage of herring and its prey in the Norwegian Sea during autumn would fill an important knowledge gap.
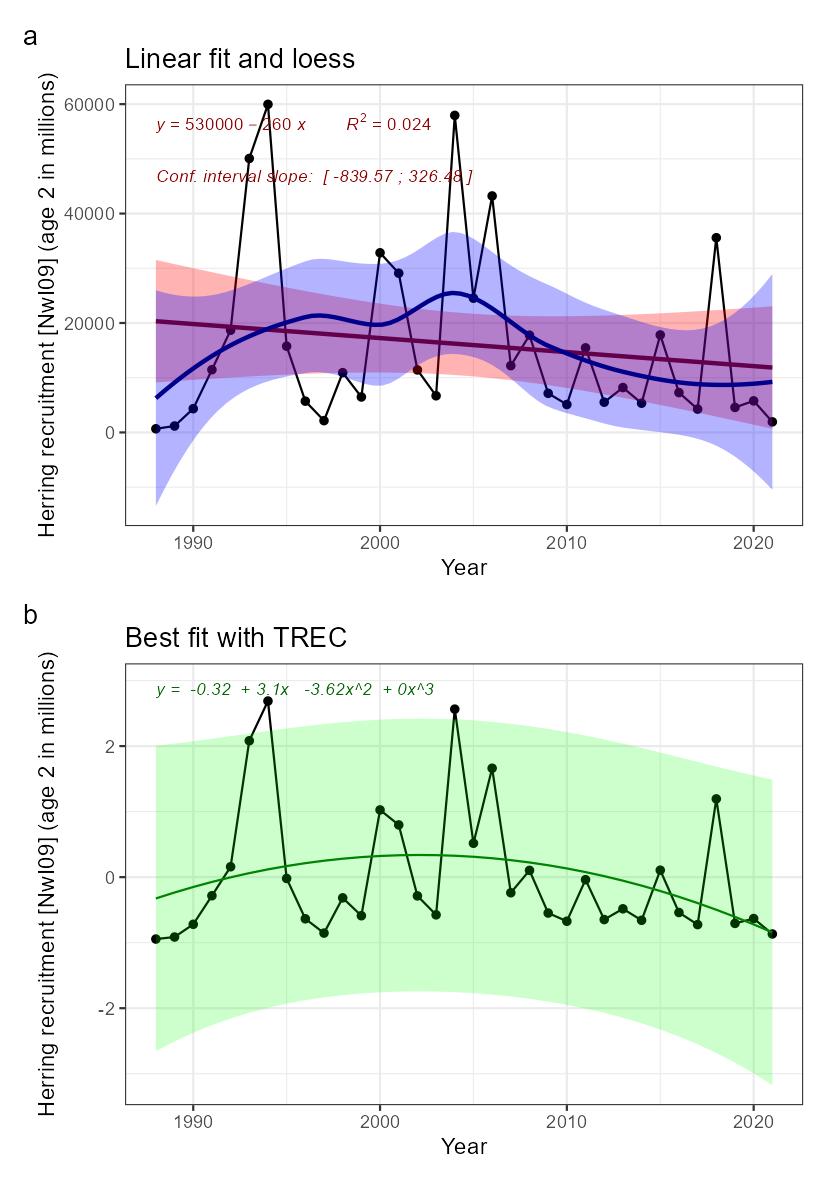
NSS herring recruitment [NwI09]
Phenomenon: Decreasing herring recruitment [NwP09]
Ecosystem characteristic: Functionally important species and biophysical structures
Key aspects of the NSS herring stock under the reference condition are described above for the indicator for stock size. Analyses using data from 1907 suggest that recruitment of the stock is highly variable between years for a period that can be considered descriptive for the reference condition (1907-1945, �����(Fiksen and Slotte, 2002)�).
The most important anthropogenic driver of change in this indicator is fisheries in the sense that high fishing pressure causing severe depletion in stock size can impair recruitment �����(Fiksen and Slotte, 2002)�. As described in the phenomenon for NSSH stock size above, future temperature increase may affect recruitment negatively ��(Toresen et al., 2019)�, but there are considerable uncertainties associated with this ��(Garcia et al., 2020)�, and climate change is therefore not considered as an important anthropogenic driver here. The understanding of the link between fisheries and NSS herring recruitment is rated as less certain, as clear effects can be assumed only after long periods of unsustainable fishing.
As herring larvae and younger age stages reside outside the Norwegian Sea, as described in the phenomena for herring stock size, changes in recruitment does not have other effects on the Norwegian Sea ecosystem than the indirect effects acting through herring stock size. As described above, we have a poor understanding of the consequences of changes in herring stock size for the ecosystem, and consequently the understanding of importance of change in NSS herring recruitment for other parts of the ecosystem is rated as less good.
Knowledge gaps: Investigate how climate variability impacts top-down processes (predation) during the early life stages of NSSH.
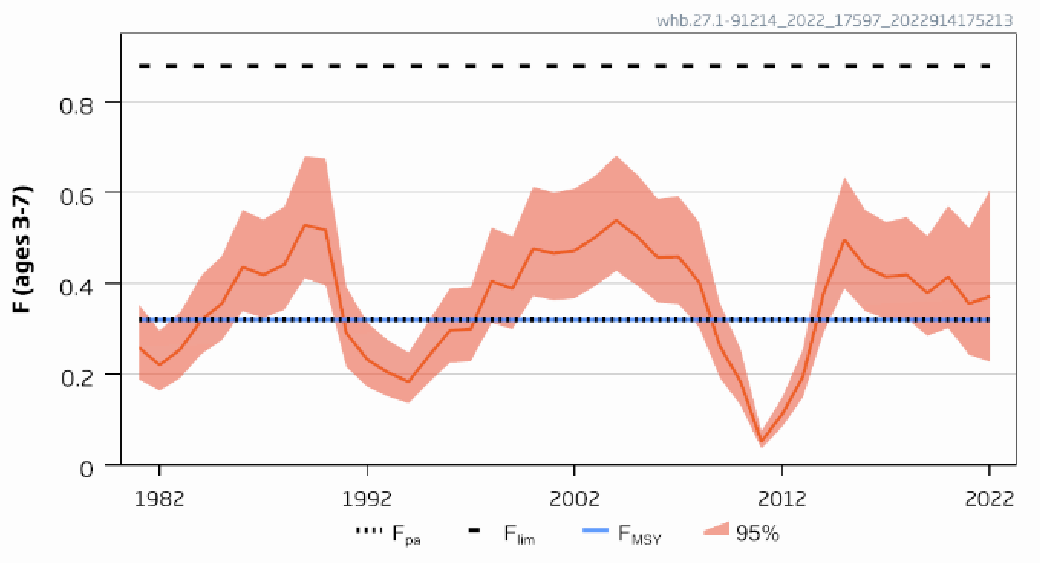
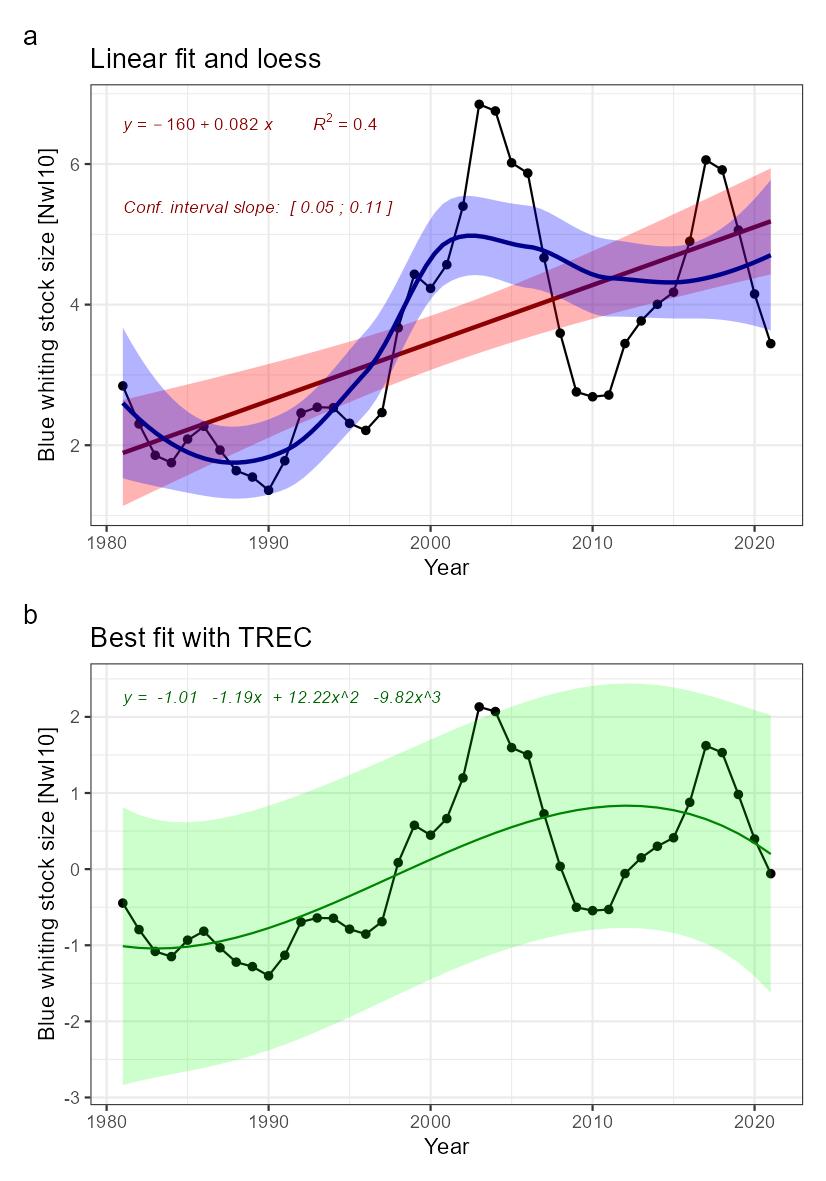
Blue whiting stock size [NwI10]
Phenomenon: Decreasing blue whiting stock size [NwP10]
Ecosystem characteristic: Functionally important species and biophysical structures
Under the reference condition, blue whiting is one of the large pelagic fish stocks in the Norwegian Sea ��(Skjoldal, 2004)�. The species is most common at 100–600 m depth but is also found close to the surface in parts of the day and close to the bottom in shallow waters. It is observed as deep as 900 meters. Adult blue whiting migrates every winter to the spawning areas west of the British Isles. Eggs and larvae are transported by currents, and the drift pattern varies from year to year. Larvae from the spawning west of Ireland can end both in the Norwegian Sea and in Bay of Biscay. The most important feeding and nursery area is the Norwegian Sea. The food of blue whiting consists mainly of euphausiids, amphipods and copepods �����(Pinnegar et al., 2015; Bachiller et al., 2016)� and they are prey for piscivorous fish ��(Dolgov et al., 2009)� and cetaceans ��(Hátún et al., 2009)�. Stock size is strongly influenced by variation in recruitment.
The most important anthropogenic driver of change in this indicator is fisheries. Around year 2000, there was considerable overfishing of the stock ��(Standal, 2006)�, causing worries about stock collapse, illustrating the potential of fisheries to cause decline in stock size. The understanding of the link between fisheries and blue whiting stock size is rated as certain.
Adult blue whiting carries out active feeding and spawning migrations in the same area as herring. Blue whiting consequently has an important role in the pelagic ecosystems of the area, both by consuming zooplankton and small fish, and by providing a food resource for larger fish and marine mammals ��(ICES, 2009a)�. Several studies have addressed the ecological interactions between blue whiting and other components of the Norwegian Sea pelagic ecosystem. The influence of interspecific competition as well as competition with the two other large plankton-feeding pelagic fish stocks, mackerel (Scomber scombrus) and Norwegian spring spawning herring (Clupea harengus) has been studied by looking at the relationship between length at age and intraspecific and interspecific biomass of these species. While some evidence of intraspecific competition was found for mackerel, no evidence was seen for competition with the other species, suggesting variation in blue whiting biomass do not have strong effects on mackerel. For herring, strong evidence for interspecific competition was found and the vertical distribution between herring and blue whiting appears to be linked so that herring occurs shallower when the abundance of blue whiting is high, indicating interaction between these species ��(Huse et al., 2012)�. Based on these findings and observations of a decline in zooplankton biomass concurrent with an increase in pelagic fish biomass, it has also been speculated that the reduction in zooplankton biomass was caused by pelagic fish and that the system is subject to top-down control ��(Huse et al., 2012)�. Subsequent modelling work based on the principle of chance and necessity, which allows reconstruction of a large number of possible ecosystem trajectories ��(Planque and Mullon, 2020)� suggests on the other hand that there is some support for bottom-up control, no support of top-down control and weak support for competition between pelagic fish species. Results related to mackerel are associated with high degree of uncertainty ��(Planque et al., 2022)�. Based on these partly conflicting results, the understanding of importance of change in blue whiting stock size for other parts of the ecosystem is rated as less good.
Knowledge gaps: In 2014 the ICES Stock Identification Methods Working Group (SIMWG) reviewed the evidence of separate stocks based on the new scientific evidence ��(ICES, 2014b)� and concluded that the perception of blue whiting in the NE Atlantic as a single‐stock unit is not supported by the best available science. SIMWG further recommended that blue whiting be considered as two units. However, there is currently no information available that can be used as the basis for generating advice on the status of the individual stocks. There is still a need for more information regarding population structure in these stocks.
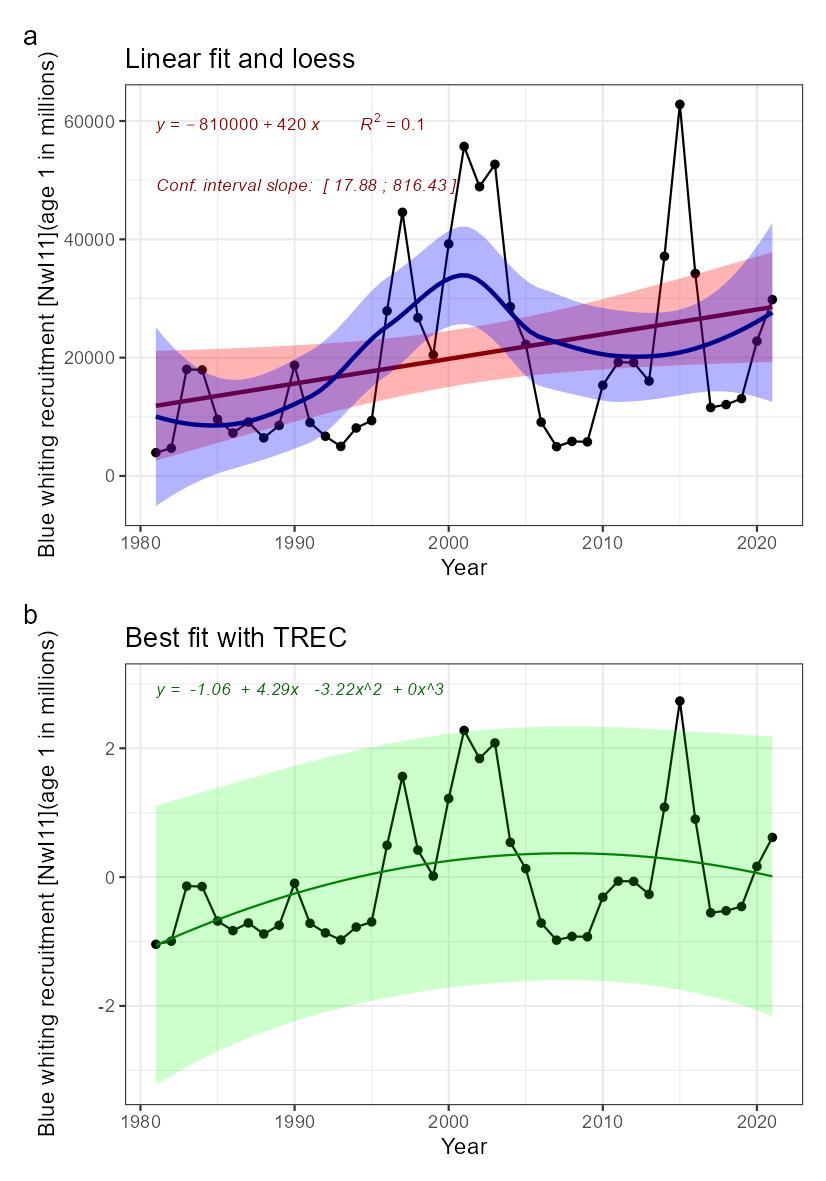
Blue whiting recruitment [NwI11]
Phenomenon: Decreasing blue whiting recruitment [NwP11]
Ecosystem characteristic: Functionally important species and biophysical structures
Key aspects of the blue whiting stock under the reference condition are described above for the indicator for stock size. Recruitment of the stock is highly variable between years. However, there have been periods with different recruitment regimes; a period with low recruitment before 1996, a high level regime in the period 1996-2005, low for 2006-2009 and variable thereafter ��(ICES, 2021d)�, but even rather low spawning stock biomasses have resulted in good recruiting year-classes. Spatial distribution of spawning varies between years due to variation in oceanographic conditions, with spawning under fresher and colder conditions in the spawning region occurring mainly along the European Continental Shelf edge west of Ireland, in particular on Porcupine Bank, while during more saline and warmer conditions, spawning expands further westward across Rockall Trough onto Rockall Plateau and shifts northward along the European Continental Shelf Spawning ��(Miesner and Payne, 2018)�. Shifts in oceanographic conditions between warm/saline and cold/fresh is linked to variation in the sub-polar gyre, with a stronger gyre producing colder and fresher conditions ��(Hatun et al., 2009)�. The eggs and larvae spawned on the Porcupine Bank area (west of Ireland) can drift both towards the south and towards the north, depending on the spawning location, oceanographic conditions, and the effects from wind force, while the spawning products from the northern spawning area west of the Hebrides always drift northwards. The northward drift spreads a major part of the juvenile blue whiting to the Norwegian Sea and adjacent areas from Iceland, Faroes and North Sea to the Barents Sea. The larvae usually settle on the deeper areas of the various shelf edges in autumn and stay more or less associated with bottom the first winter or more, gradually becoming part of the mature stock after two or three years.
The most important anthropogenic driver of change in the indicator is fisheries in the sense that high fishing pressure causing severe depletion in stock size can impair recruitment. While there was a considerable fishery on 0 group on the beginning of the 2000s, thus directly affecting recruitment, fisheries are now performed in the first and second quarter on the spawning grounds, i.e., mainly on mature fish, and thus having a potential to affect recruitment only indirectly through the size of the spawning stock. Although spawning distribution is clearly influenced by variations in the physical environment �����(Hatun et al., 2009; Miesner and Payne, 2018)�, this does not give reason to assume a link to climate change as an important driver, as this is connected to variation in the sub-polar gyre ��(Hatun et al., 2009)� and not long term changes in temperature or other parameters that are projected to change as a consequence of anthropogenic impact on the climate. Thus, climate change is not considered an important anthropogenic driver for near future changes in blue whiting recruitment. The understanding of the link between fisheries and blue whiting recruitment is rated as less certain, as clear effects can be assumed only after long periods of unsustainable fishing on the spawning stock.
The understanding of importance of change in blue whiting recruitment for other parts of the ecosystem is rated as less good.
Knowledge gaps: Focus on potential mechanisms that may account for the hypothesized links between the oceanographic climate and the recruitment dynamics.
-
The predation hypothesis
This hypothesis examines the role of mackerel predation and changes in the spawning distribution of blue whiting. Changes in the spawning distribution leads to changes in the mackerel–blue whiting larvae overlap, and therefore the degree of predation.
-
The food hypothesis
This hypothesis is based on the amount and availability of food to the larvae and juveniles. Changes in the oceanographic conditions may change the food availability and ultimately impact larval/juvenile growth, survival and recruitment. More research is required to examine these topics ��(ICES, 2009b)�.
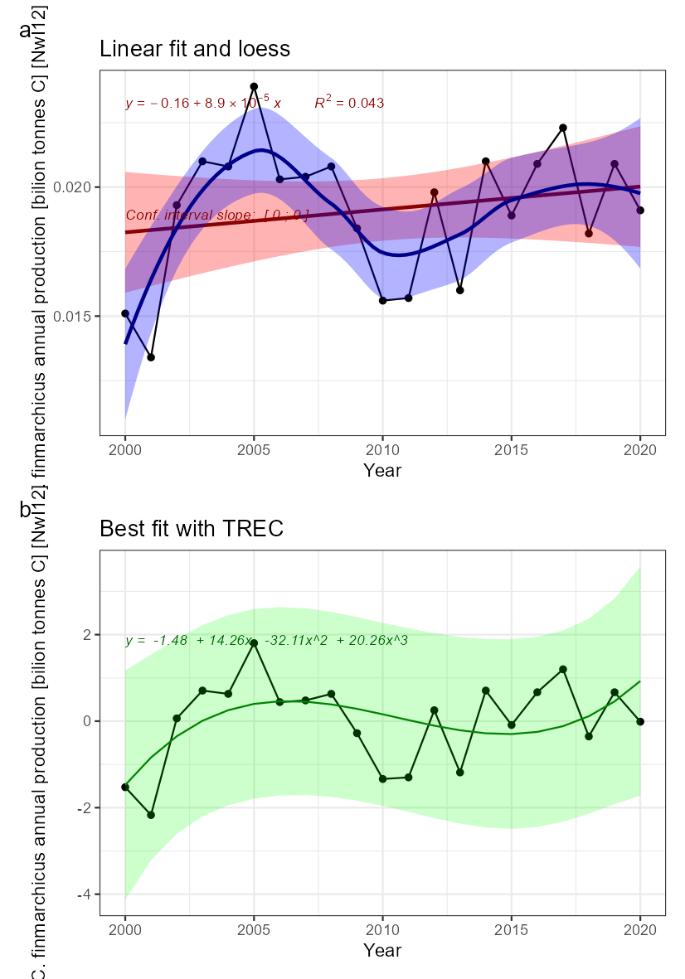
Calanus finmarchicus production [NwI12]
Phenomenon: Decreasing Calanus finmarchicus production [NwP12]
Ecosystem characteristic: Functionally important species and biophysical structures
Calanus finmarchicus is a key species in the Norwegian Sea. It is the dominant herbivore in Atlantic water masses, but it also occurs in high numbers on the cold side of the Arctic front ����� (Broms and Melle, 2007; Broms et al., 2009; Melle et al., 2014; Kristiansen et al., 2019). It is the main food of herring, mackerel and young blue whiting, and the main initial prey for larvae of cod, herring, saith and haddock (e.g. ����� Ellertsen et al. (1977); Dalpadado et al. (2000); Gislason and Astthorsson (2002); Dommasnes et al. (2004); Broms et al. (2012); Langøy et al. (2012); Bachiller et al. (2016)�).
The most important anthropogenic driver of change in the indicator is climate change. Temperature affects the abundance, distribution and phenology of plankton populations. Rising temperatures are causing species to expand at the northern edge of their distribution and retreat at the southern edge �� (Beaugrand et al., 2009). It may be difficult to disentangle the effect of temperature and advection, as species assemblages are typically associated to a given water-mass (e.g. ��Melle et al. (2004)�). During times with increasing temperature, the abundances of C. finmarchicus and other Sub-Arctic zooplankton species are expected to decrease (see phenomenon for copepod species vulnerable to higher temperature [NwP13]). To the extent that water temperature rise is associated with reduced transport of Arctic water into the Norwegian Sea, this will probably have the most instantaneous effect. Other studies have shown a negative development of mesozooplankton biomass in the Norwegian Sea since about year 2000 ����� (Kristiansen et al., 2019; ICES, 2022d; Skagseth et al., 2022; Utne et al., 2022), but we do not know which species being part of the biomass, are responsible for the decrease. In the waters west of the British Isles, �� (Planque and Fromentin, 1996) � showed a negative relationship between the abundance of C. finmarchicus and temperature, while the opposite was the case for the more temperate species C. helgolandicus. Although these waters are not part of the Norwegian Sea it is worth mentioning since it indicates that in the southern range of its distribution C. finmarchicus will respond negatively to a temperature increase. The Svinøy Standard Section, heading NW from the Svinøy Island off the coast at Møre has been sampled with vertical WP2 nets from 200m depth to the surface. The abundance of C. finmarchicus in the Atlantic region showed a decline from 1996 to 2012. In this study they made no attempts linking the changes in abundance to environmental factors �� (Dupont et al., 2017), but others have reported an increase in water temperatures in the section over the same time period �� (Skagseth and Mork, 2012). Given the lack of scientific studies, the understanding of the link between climate change and the indicator is rated as less certain.
C. finmarchicus is the major prey of pelagic fish species like herring, mackerel, and to some extent blue whiting and salmon ����� (Dalpadado et al., 2000; Langøy et al., 2012; Bachiller et al., 2016; Melle et al., 2020; Utne et al., 2022). Eggs and nauplii of C. finmarchicus are also the major prey for fish larvae, especially herring and cod. Therefore, decreased abundance of C. finmarchicus likely will have adverse effect on the individual growth, recruitment, production and distribution and phenology of key commercial fish stocks. Given the mostly circumstantial evidence described above the understanding of the consequences from change in the indicator for the rest of the ecosystem is rated as less good.
Knowledge gaps: There is a lack of knowledge about the effect of increased temperature on the abundance of cold-water species themselves and the processes involved in the numerical regulations of the populations. The effect of reduced abundance of cold-water species on key pelagic fish stocks and carbon sequestration await quantification. Combined time-series analyses and process studies based on data sampled on the same temporal and spatial scale across trophic levels probably are the way forward.
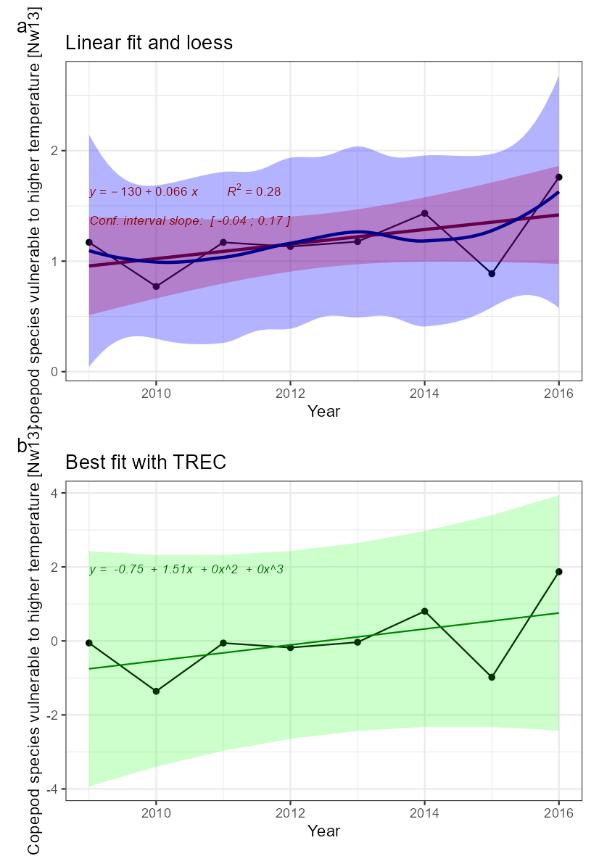
Copepod species vulnerable to higher temperature [NwI13]
Phenomenon: Decreasing number of species sensitive to higher temperatures [NwP13]
Ecosystem characteristic: Biological diversity
The Norwegian Sea contains two main water masses (e.g., Blindheim 2004). In the central and eastern Norwegian Sea, surface waters down to approximately 500 m is dominated by relatively warm and saline Atlantic water. In the west, the East Icelandic Current brings cold and less saline water of Arctic origin into the basin. Towards east this water mass dives under the Atlantic water and forms what ��Blindheim (2004)� referred to as intermediate Arctic water. The Arctic and Atlantic water masses are separated by the Arctic front and the whole region is characterised as Sub-Arctic by ��Longhurst (1998)� and later by ��Beaugrand et al. (2002a)�. Arctic and Atlantic water masses contain unique collections of zooplankton species as described by ��Wiborg (1954)�, ��Østvedt (1955)�, ��Hirche (1991)�, ��Dalpadado et al. (1998)�, ��Aßmus et al. (2009)�, ��Melle et al. (2004)�(and references therein), and ��Strand et al. (2020)�. A sampling line for CPR (Continuous Plankton Recorder) was operated during the years from 1948 to 1982, going from the Norwegian coast to Weather Station Mike. Over the years copepods with smaller body size showed great variability in abundance while larger species like C. finmarchicus and Metridia longa varied far less, showing no long-term trend ��(Aßmus et al., 2009)�. Only wind conditions showed any relationship to the variations in abundance ��(Aßmus et al., 2009)�. A key species in the Norwegian Sea is the copepod Calanus finmarchicus. Being an Atlantic species, it is the dominant herbivore in Atlantic water masses, but it also occurs in high numbers on the cold side of the Arctic front �����(Broms and Melle, 2007; Broms et al., 2009; Melle et al., 2014; Kristiansen et al., 2019)�. It is the main food of herring, mackerel and young blue whiting, and the main initial prey for larvae of cod, herring, saith and haddock (e.g. ����� Ellertsen et al. (1977); Dalpadado et al. (2000); Gislason and Astthorsson (2002); Dommasnes et al. (2004); Broms et al. (2012); Langøy et al. (2012); Bachiller et al. (2016)�). An Arctic complement to C. finmarchicus is Calanus hyperboreus ��(Hirche, 1991)�. While C. finmarchicus typically feature a one-year lifecycle, spawning at the surface closely linked to the phytoplankton spring bloom, C. hyperboreus spawn at several hundred meters during winter while the nauplii move to the surface to feed when the phytoplankton bloom occurs, a behaviour developed in response to unpredictable Arctic blooms ��(Hirche, 1991)�. ��Melle et al. (2004)� gives an overview of species common to the Atlantic and Arctic water masses of the Norwegian Sea. The Atlantic copepod community: Calanus finmarchicus, Metridia longa, Paraeuchaeta norvegica. Their Arctic equivalents often from the same genus: Calanus hyperboreus and Paraeuchaeta glacialis. By statistical analyses of the CPR data from 1958-1999, ��Beaugrand et al. (2002a)� grouped copepod species into 9 species assemblages ranging from Subtropical and warm-temperate assemblage to Arctic assemblage with their associated geographical distribution (Table 5.2).
The most important anthropogenic driver of change in the indicator is temperature increase. Temperature affects the abundance, distribution and phenology of plankton populations. Rising temperatures are causing species to expand at the northern edge of their distribution, while they are retreating at the southern edge ��(Beaugrand et al., 2009)�. It may be difficult to disentangle the effect of temperature and advection, as species assemblages are typically associated to a given water mass (e.g. ��Melle et al. (2004)�). During times with increasing temperature the abundances of copepods, being members of the Sub-Arctic and Arctic species assemblages (Table 5.2), are expected to decrease. To the extent that water temperature rise is associated with reduced transport of Arctic water into the Norwegian Sea, this will probably have the most instantaneous effect. Other studies have shown a negative development of mesozooplankton biomass in the Norwegian Sea since about year 2000 �����(Kristiansen et al., 2019; ICES, 2022d; Skagseth et al., 2022; Utne et al., 2022)�, but we do not know which species being part of the biomass, are responsible for the decrease. During years with elevated advection of cold Arctic water into the system there is an increase in the abundance of the Arctic species, C. hyperboreus �����(Kristiansen et al., 2019; Skagseth et al., 2022)�. In the waters west of the British Isles, ��(Planque and Fromentin, 1996)� showed a negative relationship between the abundance of C. finmarchicus and temperature, while the opposite was the case for the more temperate species C. helgolandicus. Although these waters are not part of the Norwegian Sea it is worth mentioning since it indicates that in the southern range of its distribution C. finmarchicus will respond negatively to a temperature increase. The Svinøy Standard Section, heading NW from the Svinøy Island off the coast at Møre has been sampled with vertical WP2 nets from 200m depth to the surface. The abundance of C. finmarchicus in the Atlantic region showed a decline from 1996 to 2012. In this study no attempts were made to link the changes in abundance to environmental factors ��(Dupont et al., 2017)�, but others have reported an increase in water temperatures in the section over the same time period ��(Skagseth and Mork, 2012)�. Given the lack of scientific studies, the understanding of the link between temperature and the indicator is rated as less certain.
The cold water species denoted above are representing the major preys of pelagic fish species like herring, mackerel, and to some extent blue whiting and salmon �����(Dalpadado et al., 2000; Langøy et al., 2012; Bachiller et al., 2016; Melle et al., 2020; Utne et al., 2022)�. Eggs and nauplii of C. finmarchicus are also the major prey for fish larvae, especially herring and cod. Therefore, decreased abundance of the cold-water copepods likely will have adverse effect on the individual growth, recruitment, production and distribution and phenology of key commercial fish stocks. Given the mostly circumstantial evidence described above the understanding of the consequences from change in the indicator for the rest of the ecosystem is rated as less good
There is a lack of knowledge about the effect of increased temperature on the abundance of cold-water species themselves and the processes involved in the numerical regulations of the populations. The effect of reduced abundance of cold-water species on key pelagic fish stocks and carbon sequestration await quantification. Combined time-series analyses, ecosystem modelling and process studies probably is the way forward.
| Name of the assemblage |
Species or taxa |
Ecological preferendum |
| 1. Subtropical and warm-temperate species assemblage |
Undeuchaeta major, Acartia danae, Paracandacia bispinosa, Euchaeta media, Temora stylifera, Scolecithrix danae, Euchaeta marina, Candacia ethiopica, Eucalanus attenuatus, Lucicutia spp., Eucalanus elongatus, Candacia pachydactyla, Rhincalanus cornutus, Euchaeta pubera, Centropages violaceus |
Oceanic and pseudo-oceanic species generally found near shelf edges and in the northward extension of the Gulf Stream |
| 2. Warm-temperate oceanic species assemblages |
Euchaeta acuta, Undeuchaeta plumosa, Euchirella rostrata, Neocalanus gracilis, Clausocalanus spp., Nannocalanus minor, Pleuromamma borealis, P. gracilis, P. abdominalis, P. xiphias, P. piseki, Calocalanus spp., Mesocalanus tenuicornis, Heterorhabdus papilliger, Centropages bradyi, Mecynocera clausi |
Oceanic warm water species, generally south of 52°N but concentration associated with the path of the North Atlantic Current above 521N east of the mid-Atlantic ridge |
| 3. Warm-temperate pseudo-oceanic species assemblage |
Euchaeta gracilis, Euchaeta hebes, Ctenocalanus vanus, Calanoides carinatus |
Warm water shelf-edge species found south of about 50°N along the European shelf edge for years prior to the 1980s |
| 4. Temperate pseudo-oceanic species assemblage |
Rhincalanus nasutus, Eucalanus crassus, Centropages typicus, Candacia armata, Calanus helgolandicus |
Species can be found in oceanic and neritic water, but their abundance is higher along shelf edges until about 55°N before the 1980s |
| 5. Shallow-water species assemblage |
Isias clavipes, Anomalocera patersoni, Labidocera wollastoni |
Species generally found above the continental shelf but mainly abundant in shallow coastal regions |
| 6. Continental shelf species assemblage |
Centropages hamatus, Temora longicornis, Pseudocalanus adult, Para-Pseudocalanus spp. |
Species generally found above the continental shelf |
| 7. Cold-temperate mixed-water species assemblage |
Aetideus armatus, Pleuromamma robusta, Acartia spp., Metridia lucens |
Species indicative of mixed water more usually found at the boundary between warm water and subarctic water |
| 8. Subarctic species assemblage |
Heterorhabdus norvegicus, Scolecithricella spp., Euchaeta norvegica, Calanus finmarchicus |
Species indicative of subarctic water |
| 9. Arctic species assemblage |
Calanus hyperboreus, Metridia longa, Calanus glacialis |
Species indicative of arctic water |
Table 5.2 Biological composition of species assemblages and their ecological preferendum. From Beaugrand et al. 2002a. The time period considered in the analyses was 1958–1999. The names of some species assemblages have been slightly modified in comparison to those used in Beaugrand et al. (ibid.).
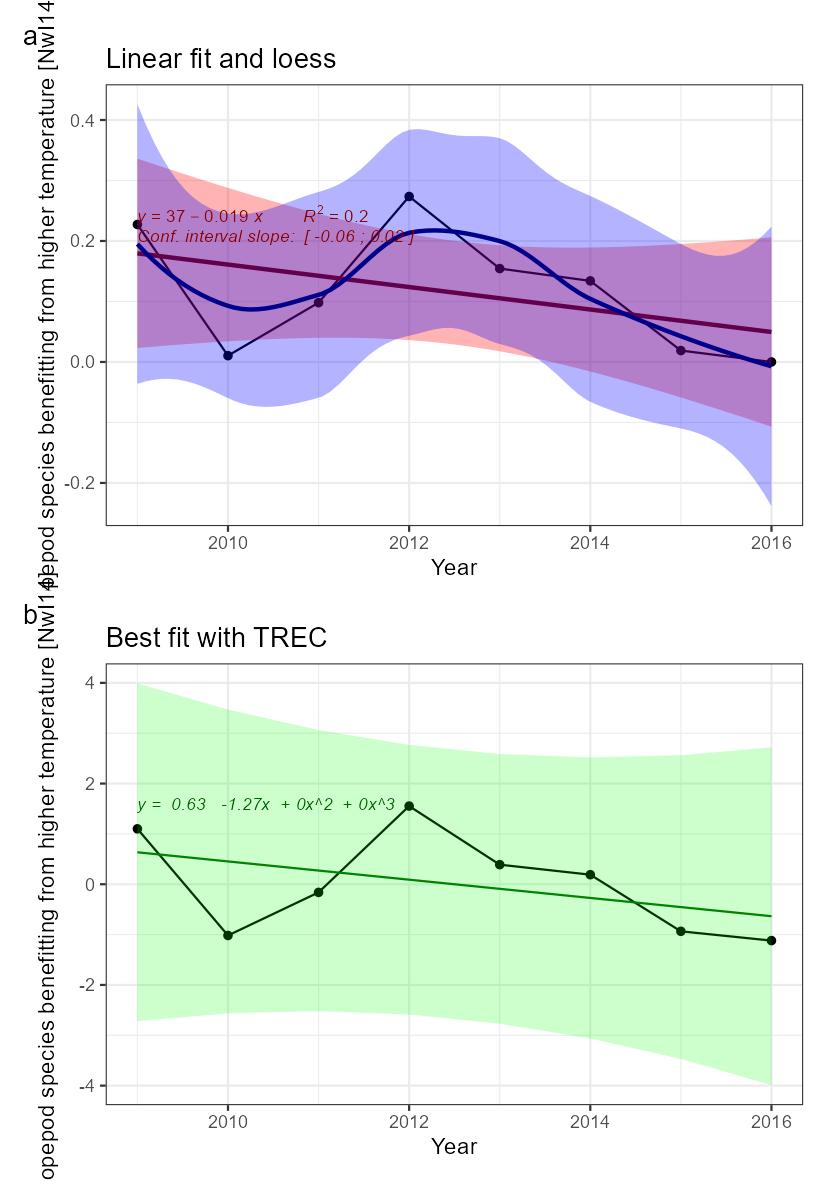
Copepod species benefitting from higher temperature [NwI14]
Phenomenon: Increasing number of copepod species benefitting from higher temperatures [NwP14]
Ecosystem characteristic: Biological diversity
The Norwegian part of the Norwegian Sea contains two main water masses (e.g. ��Blindheim (2004)�). In the central and eastern Norwegian Sea, surface waters down to approximately 500 m is dominated by relatively warm and saline Atlantic water. In the west, the East Icelandic Current brings cold and less saline water of Arctic origin into the basin. Towards east this water mass dives under the Atlantic water and forms what ��Blindheim (2004)� referred to as intermediate Arctic water. The Arctic and Atlantic water masses are separated by the Arctic front and the whole region is characterised as Sub-Arctic by ��Longhurst (1998)� and later by ��Beaugrand et al. (2002a)�. Arctic and Atlantic water masses contain unique collections of zooplankton species as described by ��Wiborg (1954)�, ��Østvedt (1955)�, ��Hirche (1991)�, ��Dalpadado et al. (1998)�, ��Aßmus et al. (2009)�, ��Melle et al. (2004)(and references therein), and ��Strand et al. (2020)�. A sampling line for CPR (Continuous Plankton Recorder) was operated during the years from 1948 to 1982, going from the Norwegian coast to Weather Station Mike. Over the years copepods with smaller body size showed great variability in abundance while larger species like C. finmarchicus and Metridia longa varied far less, showing no long-term trend ��(Aßmus et al., 2009)�. Only wind conditions showed any relationship to the variations in abundance ��(Aßmus et al., 2009)�. A key species in the Norwegian Sea is the copepod Calanus finmarchicus. Being an Atlantic species, it is the dominant herbivore in Atlantic water masses, but it also occurs in high numbers on the cold side of the Arctic front �����(Broms and Melle, 2007; Broms et al., 2009; Melle et al., 2014; Kristiansen et al., 2019)�. It is the main food of herring, mackerel and young blue whiting, and the main initial prey for larvae of cod, herring, saith and haddock (e.g. ����� Ellertsen et al. (1977); Dalpadado et al. (2000); Gislason and Astthorsson (2002); Dommasnes et al. (2004); Broms et al. (2012); Langøy et al. (2012); Bachiller et al. (2016)�). An Arctic complement to C. finmarchicus is Calanus hyperboreus ��(Hirche, 1991)�. While C. finmarchicus typically feature a one-year lifecycle, spawning at the surface closely linked to the phytoplankton spring bloom, C. hyperboreus spawn at several hundred meters during winter while the nauplii move to the surface to feed when the phytoplankton bloom occurs, a behaviour developed in response to unpredictable Arctic blooms ��(Hirche, 1991)�. ��Melle et al. (2004)� gives an overview of species common to the Atlantic and Arctic water masses of the Norwegian Sea. The Atlantic copepod community: Calanus finmarchicus, Metridia longa, Paraeuchaeta norvegica. Their Arctic equivalents often from the same genus: Calanus hyperboreus and Paraeuchaeta glacialis. By statistical analyses of the CPR data from 1958-1999, ��Beaugrand et al. (2002a)� grouped copepod species into 9 species assemblages ranging from Subtropical and warm-temperate assemblage to Arctic assemblage with their associated geographical distribution (Table 5.2).
The most important anthropogenic driver of change in the indicator is temperature increase. Temperature affects the abundance, distribution and phenology of plankton populations. Rising temperatures are causing species to expand at the northern edge of their distribution, while they are retreating at the southern edge ��(Beaugrand et al., 2009)�. It may be difficult to disentangle the effect of temperature and advection, as species assemblages are typically associated to a given water mass (e.g. ��Melle et al. (2004)�). During times with increasing temperature the abundances of copepods being members of the oceanic warm-temperate species assemblages (Table 5.2) are expected to increase. To the extent that water temperature rise is associated with increased transport of Atlantic water in the extension of the North-Atlantic current into the Norwegian Sea, this will probably have the most instantaneous effect. ��Strand et al. (2020)� analysed spatial and seasonal occurrences of four Calanus species in CPR data from the Northern North Sea, the Norwegian Sea and western Barents Sea. The warm water representative of the four, C. helgolandicus, prevailed in the North Sea while diminishing abundances were found northwards towards the Barents Sea. With increasing temperature, the ratio of C. helgolandicus to C. finmarchicus is expected to increase ��(Strand et al., 2020)�. In the waters west of the British Isles, ��Planque and Fromentin (1996)� showed a negative relationship between the abundance of C. finmarchicus and temperature, while the opposite was the case for the more temperate species C. helgolandicus. Although these waters are not part of the Norwegian Sea it is worth mentioning since it indicates positive effect on C. helgolandicus abundance from temperature increase, in waters up-stream to the Norwegian Sea. Given the lack of scientific studies, the understanding of the link between temperature and the indicator is rated as less certain.
Many of the warm-water species listed by ��Beaugrand et al. (2002a)� are smaller and store fat for overwintering to a lesser degree than C. finmarchicus, which dominate copepod biomass today. Thus, we can expect deprived feeding conditions for pelagic fish species like herring, mackerel, and to some extent blue whiting and salmon if a switch towards smaller species occurs following a temperature rise �����(Dalpadado et al., 2000; Langøy et al., 2012; Bachiller et al., 2016; Utne et al., 2022)�. Eggs and nauplii of C. finmarchicus are also the major prey for fish larvae, especially herring and cod. C. helgolandicus, being an autumn spawner, at least in the North Sea, may not provide nauplii and eggs during spring to the same extent that C. finmarchicus. Therefore, increased abundance of the warm-water copepods likely will have adverse effect on the individual growth, recruitment and production of key commercial fish stocks. Given the mostly circumstantial evidence described above the understanding of the consequences from change in the indicator for the rest of the ecosystem is rated as less good
There is a lack of knowledge about the effect of increased temperature on the abundance of warm-water species and the processes involved in the numerical regulations of the populations. The effect of reduced abundance of warm-water species on key pelagic fish stocks and carbon sequestration await quantification. Combined time-series analyses and process studies probably is the way forward.
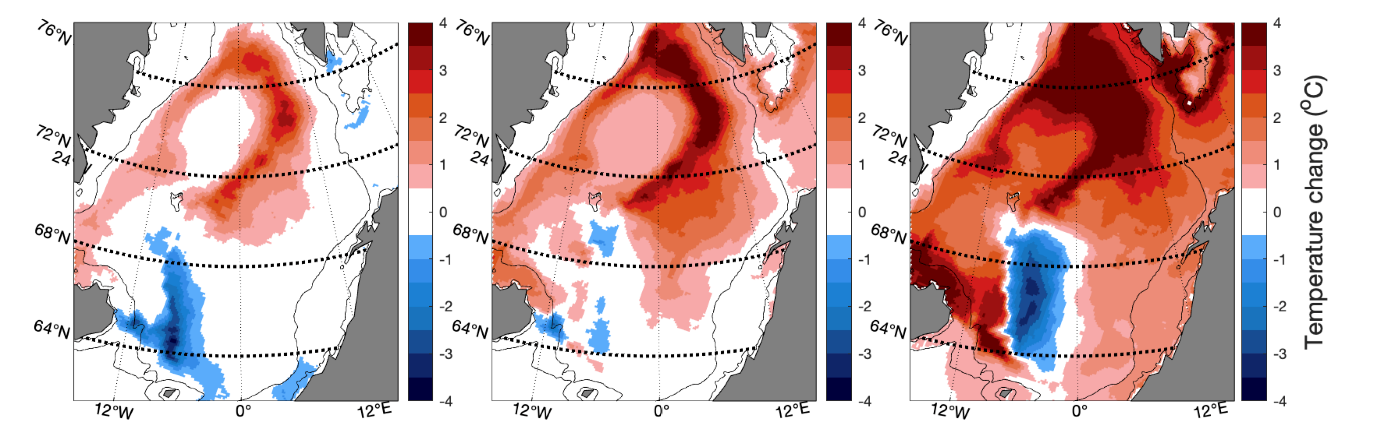
Heat content [NwI15]
Phenomenon: Increasing heat content [NwP15]
Ecosystem characteristic: Abiotic factors
Under the reference condition, which for abiotic factors is defined as the climate for 1961-1990 period, the Heat Content (HC) was generally low but with pronounced decadal variability. The number of observations going into the HC estimate were infrequent from the 1950s and has increased over time through the initiation of the fixed repeated sections in the 1970-80s, start of annual spring spatial surveys from 1995, and finally the implementation of the ARGO buoy program in the early 2000s. Based on this, estimates from the 1961-1990 period, especially the first half, are less certain.
The most important anthropogenic driver of heat content is anthropogenic greenhouse warming ��(Pörtner et al., 2019)�. Further, due to the northward amplification of global warming we expect higher increase in the heat content of the Norwegian Sea ecoregion compared with marine areas at lower latitudes �����(Skagseth and Mork, 2012; Mork et al., 2014; Mork et al., 2019)�. Based on the estimated record of heat content starting in 1951 ��(Mork et al., 2014)�, natural variability is likely to dominate over an anthropogenic signal on annual to multi-decadal scale. The understanding of the link between anthropogenic impact on the climate and the indicator is still rated as certain.
Changes in heat content can affect the Norwegian Sea ecosystem across different trophic levels ��(Skjoldal, 2004)�. Species composition of zooplankton is expected to be affected, with possible significant effects on higher trophic levels (see phenomena for NwI15 and NwI16). Migration of the major pelagic fish stocks may also be affected by changes in heat content, although it should be noted that this can also be strongly influenced by other factors, such as stock size. For example, geographical expansion of mackerel in the Norwegian sea between 2007 and 2016 has been attributed to increases in stock size, with temperature determining the direction of the changes in expansion �����(Olafsdottir et al., 2019)�. ��Nikolioudakis et al. (2018)�, looking at changes for the years 2011-2017 and using a different statistical framework than �����Olafsdottir et al. (2019)�, found no role of stock size but a clear role of temperature in driving changes in mackerel geographic distribution. The understanding of the consequences from change in the heat content for the rest of the ecosystem is rated as good.
Warming of the Atlantic water masses depend on the inflow of Atlantic Water, surface heating during summer and cooling during winter, and inflow of Arctic Water from the Iceland and Greenland Seas. More research supported by sustained observation through Argo buoys and other observation platforms is needed to better understand the relative contribution from these sources.
Freshwater content [NwI16]
Phenomenon: Increasing freshwater content [NwP16]
Ecosystem characteristic: Abiotic factors
Under the reference condition, which for abiotic factors is defined as the climate for 1961-1990 period, the freshwater content shows a general increase and prominent decadal variability on top of this trend �����(Dickson et al., 1988; Blindheim et al., 2000; Mork and Blindheim, 2000; Häkkinen and Rhines, 2004; Skagseth et al., 2008; Mork et al., 2014; Mork et al., 2019)�. The number of observations going into the estimation of freshwater content were low from the 1950s and increased with the initiation of fixed repeated sections in the 1970-80s and further with the start of annual spring spatial surveys from 1995, and finally with the implementation of the ARGO buoy program in the early 2000s. Based on this, estimates from the reference period, especially the first half, are less certain.
The most important anthropogenic driver of freshwater content is anthropogenic climate warming ��(Pörtner et al., 2019)�. With high certainty anthropogenic impact on the climate will lead to an increased hydrological cycle with increased evaporation in subtropics, and increased precipitation at mid-latitude. The integrated effect of this on the freshwater content is uncertain. The Greenland Ice cap has melted at a rate of 279 billion tonnes/year since 1990 ��(NASA, 2022)�. The faith of the Greenland ice cap meltwater, even expected to accelerate in future, is uncertain but have the potential to drastically increase the amount of freshwater and change the conditions in the Norwegian Sea ecoregion. Arctic sea ice melt also has the potential to contribute with freshwater ��(Kacimi and Kwok, 2022)�, and events of freshwater from the Arctic are previously reported to freshen the Atlantic layer of the Norwegian Sea ��(Dickson et al., 1988)�. The understanding of the link between anthropogenic impact on the climate and the indicator is rated as certain.
Increased amount of freshwater will contribute to increased stratification, which may affect phytoplankton dynamics (see phenomena NwP01 and NwP02). In addition, Freshwater Content has for the most recent decades been an indicator of the overall influence of sub-artic waters entrained into the Atlantic Water entering the Norwegian Sea ��(Hatun et al., 2005)�. Freshwater content is positively correlated to silicate in the Atlantic water ��(Rey, 2012)�. High levels of silicate favor diatom growth until ambient levels are depleted below 1-2 mol m-3 ��(Egge and Aksnes, 1992; Brown et al., 2003)�. Freshwater content is also positively correlated to overall zooplankton biomass and abundance of the large Arctic zooplankton species Calanus hyperboreus ��(Skagseth et al., 2022)�. The understanding of the consequences of changes in the indicator for other parts of the ecosystem is rated as good.
Freshwater Content have proven to be a very powerful indicator for the Norwegian Sea pelagic ecosystem. To take full advantage of this indicator, better understanding of the mechanistic relations is required.
Inflow of Arctic Water [NwI17]
Phenomenon: Change in volume of Arctic water [NwP17]
Ecosystem characteristic: Abiotic factors
Arctic Water is here defined as water with salinity < 34.9 at depth range 150-300m in Norwegian Basin. These data are based on similar hydrographic data as for HC and FC for the period 1995-2021. We do not have estimates for the reference period (1961-1990).
The most important anthropogenic driver of change in the indicator is climate change. The characteristics of the Arctic Water, produced in the Greenland – and Iceland Seas, depend on the source waters, the Polar - and Atlantic Water, as well as their modification by the local atmospheric forcing ��(Helland-Hansen and Nansen, 1909)�. Anthropogenic glacier- and sea ice melt may lead to fresher Arctic Water. In the end this could increase the Arctic influence in the Norwegian Sea under the assumption of similar flux into the Norwegian ecoregion. The exchange between the Iceland and Greenland Seas with the Norwegian Sea is in part wind driven ��(Spall et al., 2021)�, but knowledge of how the wind pattern may develop under climate change is uncertain. Overall, the understanding of the link between the driver and change in the indicator is rated as less certain.
The amount of Artic Water is an index of advection of Arctic Water to the Norwegian Sea ecoregion. It is characterized by elevations in levels of nutrients, total abundance of zooplankton and abundance of large zooplankton �����(Kristiansen et al., 2016; Kristiansen et al., 2019; Skagseth et al., 2022)�. Wild salmon feeding is found to improve in periods of increased amount of Arctic Water �����(Utne et al., 2022; Vollset et al., 2022)�. The understanding of the consequences of change in the indicator for the rest of the ecosystem needs to be further challenged but is still rated as good.
There is lack of data to resolve the mechanistic driving of Arctic Waters from the west into the Norwegian Sea ecoregion. Given the recent studies pointing the importance of the Arctic Water �����(Kristiansen et al., 2016; Kristiansen et al., 2019; Skagseth et al., 2022; Vollset et al., 2022)�, high priority should be given to improve the mechanistic understanding of this driver and its biological implication.
Stratification [NwI18]
Phenomenon: Increasing stratification [NwP18]
Ecosystem characteristic: Abiotic factors
Stratification is here defined as the density difference between 10m and 200m in the Norwegian and Lofoten basins. The indicator is based on the same hydrographic data as for Heat content and Freshwater content for the period 1995-2021. We do not have estimates for the reference period that has been set for climate (1961-1990). As the upper layer warms in the spring, vertical circulation of the upper water column changes from a deep winter to a shallow mixed layer. This is closely linked to the onset of the spring bloom ��(Sverdrup, 1953; Skjoldal, 2004)�. Storms will break down stratification and contribute to input of nutrients to the upper water column. Intensity of storms in winter will influence the amount of nutrients available at the onset of the spring bloom while the frequency of storms during summer will contribute to renewed input of nutrients and increased primary production ��(Lasker, 1981)�.
The most important anthropogenic driver of change in the indicator is climate change. Warming of the upper layer will increase the stability of the upper water column ��(Li et al., 2020)�. Climate change is also causing increased atmospheric humidity which may cause stronger winds and thus more energy for ocean mixing ��(Makarieva et al., 2013)�, in effect causing a deeper less stratified mixed layer. In addition, increased freshwater input due to an increased hydrological cycle that with high certainty is linked to climate change (see phenomenon NwP16), will contribute to increased stratification. The overall effect of these processes is an increase in stratification ��(Pörtner et al., 2019)�. Although the understanding of the links between climate change and each of these processes is rated as certain, the understanding of the link between the climate change and their combined impact on the indicator is rated as less certain.
As the onset of the spring bloom is closely linked to the transition from a deep winter – to a shallow mixed layer, change in the indicator may have consequences for primary production, affecting both timing and overall production. Such effects may propagate to the zooplankton community, affecting both overall production and match or mismatch between new primary production and zooplankton reproduction and growth (see phenomena NwP01 and NwP02). The understanding of the consequences of changes in the indicator for other parts of the ecosystem is rated as good.
Stratification can be estimated in numerous ways. Further work is underway to evaluate how the stratification parameter should be defined especially utilizing ARGO data providing that provide depth-time hydrographic profiles.
Inflow of Atlantic water [Nw19]
Phenomenon: Decreasing inflow of Atlantic water [NwP19]
Ecosystem characteristic: Abiotic factors
The Norwegian Atlantic Current (NwAC) is the poleward extension of the Gulf Stream and serves as a conduit of warm and saline Atlantic water from the North Atlantic to the Arctic Ocean. The inflow of Atlantic water is an important determinant of the local climate in the Norwegian Sea �����(Mork et al., 2014; Skagseth et al., 2022)�. Here we include an index of the Atlantic inflow to the Nordic Seas, based on moored current and temperature measurements in the NwAC �����(Orvik and Skagseth, 2003)� over the 25-year period 1995–2022. Thus, this does not overlap with the period that has been defined as descriptive for the reference condition for climate.
The NwAC is both thermohaline and wind driven, and the influence these two factors are likely time scale dependent ��(Skagseth et al., 2008)�. There are likely two opposing effects. On seasonal to annual time scale increased winds assumably will amplify the NwAC �����(Skagseth et al., 2004; Bringedal et al., 2018; Orvik, 2022)�. On longer time scales thermohaline forcing (mainly a weaker cooling) may reduce and in effect weaken the NwAC �����(Spall, 2010; Bringedal et al., 2018)�. Overall, the Atlantic inflow is likely to show moderate reduction as a consequence of climate change. While the understanding of the link between climate change and each of the two processes described above (wind driven strengthening and thermohaline driven weakening of the inflow) is rated as certain, the understanding of their combined impact on the indicator is rated as less certain.
The Atlantic Inflow with the NwAC carries an enormous amount of heat ��(Orvik and Skagseth, 2003)�, salt and nutrients and thus in a broad sense have the potential to affect all trophic levels in the Norwegian Sea ecoregion. Changes in this indicator may lead to large changes in the ecosystem functioning. Processes that are expected to be affected include primary production, organism metabolism (increasing with temperature), zooplankton species composition (see phenomena NwP13 and NwP14) and area of habitat suitable for the main pelagic fish species ��(Skjoldal, 2004)�. This indicator representing the variability in the strength of the Atlantic inflow is assumed to be important not only for the Norwegian Sea but also for the downstream Barents Sea and the Arctic Ocean. The understanding of the consequences of changes in the indicator for other parts of the ecosystem is rated as good.
The processes governing the Inflow of Atlantic Water is still not fully resolved and further observations are needed to advance this understanding.
Nutrients [NwI20]
Phenomenon: Change in concentration of nutrients [NwP20]
Ecosystem characteristic: Abiotic factors
Concentrations of nitrate is important for determining the level of total primary production while silicate is the single most essential element for sustained diatom growth and thus determines whether the phytoplankton community is dominated by diatoms or other groups of phytoplankton. Limitations in access to silicate and other macronutrients in the Norwegian Sea may shorten the spring diatom bloom period and hamper zooplankton growth, which in turn may have consequences for growth and development of commercially important fish stocks ��(Egge and Aksnes, 1992; Gundersen, 2020)�. Ocean circulation changes are shown to have a major influence on the amount and composition of nutrients in the Norwegian Sea �����(Garcia and Levitus, 2006; Rey, 2012; Hatun et al., 2017; Gundersen, 2020)�. In addition, the stratification and thus the vertical mixing determines the amount of nutrients in the photic zone that are made available for primary production (see phenomenon NwP18).
The most important anthropogenic driver of change in the indicator is climate change. Greenland Ice Cap melt is expected to add nutrient rich meltwater to the Norwegian Sea. The relative strength of Atlantic and Arctic inflow influences nutrient concentrations in the Norwegian sea, with increasing Arctic inflow contributing to higher nutrient levels (see phenomenon NwP17). As the understanding of the link between climate change and the inflow of Arctic water is rated as less certain (ibid.), understanding of the link between climate change and the indicator nutrients is also rated as less certain. Given this uncertainty, there is no clear expectation of either an increase or decrease in nutrient concentrations as a consequence of climate change.
As the seasonal growth of copepods (Calanus spp.) is tightly coupled to the diatom spring bloom ��(Egge and Aksnes, 1992)�, a reduction in silicate could have a strong effect on their production. Silicate uptake by diatoms diminishes strongly below ambient silicate concentrations of 1–2 mol m−3 ��(Egge and Aksnes, 1992; Brown et al., 2003)�. This means that the main growth of diatoms is expected to take place above this concentration level. A decrease in diatom biomass due to the silicate reduction during the spring bloom would leave larger concentrations of unused nitrate that would be utilized by other phytoplankton forms leading to other routes for channeling the produced energy to higher trophic levels. Thus, a reduction in silicate could have a strong effect on copepod production, and further affect the major fish stocks in the Norwegian Sea.
Between 2000 and 2010, there was a reduction in zooplankton biomass in the Norwegian Sea. It has been suggested that the main reason was a strong increase in the biomass of several pelagic fish stocks such as herring, blue whiting, and mackerel ��(Gjøsæter et al., 2011)�. Based on this, it has been hypothesized that the ecosystem in the Norwegian Sea is under top–down control. However, the 20% decrease in silicate concentrations in the same period may also have had an impact on the reduction in zooplankton biomass. Hence, the possibility that bottom–up control is also present cannot be excluded ��(Rey, 2012)�. In addition, due to their large size and rapid sinking rate, diatoms also play a key role in the export of biological material to deeper waters and therefore in the biogeochemical cycles in the ocean. Overall, the understanding of consequences from changes in the indicator for other parts of the ecosystem is rated as good.
Winter silicate concentrations in the Norwegian and Barents Seas is controlled by the dynamics of the North Atlantic Subpolar Gyre, and its subsequent effect on the inflow into the Norwegian Sea, should be considered when attempting to make realistic ecosystem predictions. Continuous long and regular time-series observations of nutrients is needed to get a better understanding of the natural variability in marine ecosystems.
pH [NwI21]
Phenomenon: Decreasing pH [NwP21]
Ecosystem characteristic: Abiotic factors
Under the reference condition, the water column is basic with a surface pH of about 8. The most important anthropogenic driver of change in the indicator is climate change. Oceanic uptake of excess atmospheric CO2 released by human activities, such as burning of fossil fuels and industrialisation, have increased the amount of CO2 in the oceans. Since 1985, observations of the global ocean show that pH in surface water has decreased by about 0.002 per year (Copernicus Marine Services, 2021). This corresponds to an increase in hydrogen ions (less basic ocean). For the Nordic Seas region, surface water pH has decreased at a slightly faster rate relative to the global ocean by 0.002-0.003 per year in the period 1981-2019 (Fransner et al., 2022). Continued pH decrease is rated as highly likely (Pörtner et al., 2019). The understanding of the link between driver and change in the indicator is rated as certain.
Altered pH may directly affect the internal cellular processes in marine organisms, such as the ion pumps and other redox reactions. Changes in pH may also affect the availability and toxicity of vital metals, potentially changing biological production. Also, increased pCO2 may lead to hypercapnia in fish if exceeding levels 1000 ppm ��(McNeil and Sasse, 2016)�. However, the current understanding of the effect of reduced pH on ecosystems is mainly based on acute, short term-experiments (e.g., ��Browman (2016)�). Hence the understanding of the importance of changes in the indicator for the ecosystem is rated as less good. There are large knowledge gaps of the effect of reduced pH directly on marine organisms and ecosystems. The effects need to be related to studies of adaptive capacity and multi-stressors. This also requires multi-disciplinary, observational long-term data sets in relevant areas ��(Browman, 2016)�.
Aragonite saturation [NwI22]
Phenomenon: Decreasing aragonite saturation [NwP22]
Ecosystem characteristic: Abiotic factors
Under the reference condition, aragonite saturation is high enough for calcifying organisms with aragonitic shells and skeletons to occur with biomasses high enough to sustain food webs in the Norwegian Sea and ecological processes characterising this regional ecosystem.
The most important anthropogenic driver of change in the indicator is climate change. Oceanic uptake of excess atmospheric CO2 released by human activities, such as burning of fossil fuels and industrialisation, has increased the amount of CO2 in the oceans over a relatively short time period. The oceanic carbonate ion concentration (CO32-) is driving the saturation of calcium carbonate (CaCO3) biominerals, including aragonite, and the chemical dissolution of the CaCO3 biominerals. Decreasing pH (from increasing ocean CO2) has resulted in a decrease in the calcium carbonate saturation state (Ω), with consequences for the dissolution potential and calcification process. Aragonite is the most labile form of CaCO3 in the ocean and the Nordic Seas region has shown decreased Ω of 0.012 per year in the period 1981-2019 and CaCO3 undersaturation in the depth layer of 1000–2000 m ��(Fransner et al., 2022)�. Continued decrease of Ω is rated as highly likely ��(Pörtner et al., 2019)�. The understanding of the link between driver and change in the indicator is thus rated as certain.
The lowering of CaCO3 saturation states impacts CaCO3 shell-forming marine organisms from plankton to benthic molluscs, echinoderms, and corals. Many calcifying species exhibit reduced calcification and growth rates in laboratory experiments under high-CO2 conditions (e.g., �����Kroeker et al. (2013); Manno et al. (2017)�). Another consequence is also the shoaling of aragonite saturation horizon (Ω<1) in the ocean, which will continue and has consequences for cold water corals and their ability to withstand erosion and continue to grow ��(ICES, 2014a)�. At Ω<1 more energy is required by organisms to produce CaCO3 (e.g., �����Comeau et al. (2013)�). Climate-driven changes such as ocean warming enhance the effect of low saturation states. However, the current understanding of the effect of Ω in the ecosystem is mainly based on acute, short term-experiments and ecosystem modelling ��(Browman, 2016)�.
Several economically important shellfish species can be weakened by ocean acidification (e.g. �����Agnalt et al. (2013); Andersen et al. (2013)�), and this could also be the case for cold-water coral reefs that are found along the Norwegian coast ��(Turley et al., 2007)�. Cold-water corals build their structures out of aragonite and have compensation mechanisms to be able to calcify when ΩAr <1. However, the calcification rates and strength of the structures is reduced under low ΩAr ��(Hennige et al., 2015)�. Cold-water coral reefs and their ecosystems are therefore likely to be adversely affected if seawater becomes undersaturated with respect to aragonite. The cold-water coral sites in the Nordic Seas are generally located between 0 and 500 m depth and currently the aragonite saturation horizon is located at greater depths. However, model projections show that shoaling of the horizon may expose cold-water reefs to corrosive waters by the end of this century ��(Fransner et al., 2022)�. Further, some non-calcareous organisms have shown to be adversely affected by changes in CO2 or low pH, and other organisms even respond positively to high CO2 content and low pH ��(Dupont and Pörtner, 2013)�.
There are large knowledge gaps about the thresholds and adaptive capacity of organisms to perform calcification at low saturation states in the ocean. The effect on the marine ecosystem is little understood and the effects need to be related to studies of adaptive capacity and influence of several different environmental stressors ��(Rastrick et al., 2018)�. This also requires multi-disciplinary, observational long-term data sets in relevant areas. Overall, the understanding of the importance of changes in the indicator for the ecosystem is rated as less good.
References
Agnalt, A. L., Grefsrud, E. S., Farestveit, E., Larsen, M., and Keulder, F. 2013. Deformities in larvae and juvenile European lobster (Homarus gammarus) exposed to lower pH at two different temperatures. Biogeosciences, 10: 7883-7895.
Allan, B. J. M., Ray, J. L., Tiedemann, M., Komyakova, V., Vikebø, F., Skaar, K. S., Stiasny, M. H., et al. 2021. Quantitative molecular detection of larval Atlantic herring (Clupea harengus) in stomach contents of Atlantic mackerel (Scomber scombrus) marks regions of predation pressure. Scientific Reports, 11: 5095.
Andersen, S., Grefsrud, E. S., and Harboe, T. 2013. Effect of increased p CO2 level on early shell development in great scallop (Pecten maximus Lamarck) larvae. Biogeosciences, 10: 6161-6184.
Anker-Nilssen, T. 1987. The breeding performance of puffins Fratercula arctica on Røst, northern Norway in 1979-1985. Fauna norv Ser C Cinclus 10: 21–38.
Anker-Nilssen, T. 1992. Food supply as a determinant of reproduction and population development in Norwegian Puffins Fratercula arctica. PhD-thesis. University of Trondheim.
Anker-Nilssen, T., Barrett, R. T., Lorentsen, S.-H., Strøm, H., Bustnes, J. O., Christensen-Dalsgaard, S., Descamps, S., et al. 2015. SEAPOP – De ti første årene. SEAPOP Nøkkeldokument 2005-2014. Norwegian Institute for Nature research, Norwegian Polar Institute, and Tromsø University Museum, Trondheim/Tromsø. 58 pp.
Anker-Nilssen, T., and Øyan, H. S. 1995. Hekkebiologiske langtidsstudier av lunder på Røst. NINA fagrapport 15. Trondheim.
Anker-Nilssen, T., and Aarvak, T. 2006. Tidsseriestudier av sjøfugler i Røst kommune, Nordland: resultater med fokus på 2004 og 2005. - NINA Rapport 133. 85 pp.
Arneberg, P., Husson, B., Siwertsson, A., Albretsen, J., Børsheim, K. Y., Denechaud, C., Durant, J., et al. Panel-based Assessment of Ecosystem Condition of the North Sea shelf ecosystem. Rapport fra Havforskningen.
Asbjørnsen, H., Årthun, M., Skagseth, Ø., and Eldevik, T. 2020. Mechanisms Underlying Recent Arctic Atlantification. Geophysical Research Letters, 47: e2020GL088036.
Aßmus, J., Melle, W., Tjøstheim, D., and Edwards, M. 2009. Seasonal cycles and long-term trends of plankton in shelf and oceanic habitats of the Norwegian Sea in relation to environmental variables. Deep Sea Research Part II: Topical Studies in Oceanography, 56: 1895-1909.
Astthorsson, O. S., Valdimarsson, H., Gudmundsdottir, A., and Óskarsson, G. J. 2012. Climate-related variations in the occurrence and distribution of mackerel (Scomber scombrus) in Icelandic waters. Ices Journal of Marine Science, 69: 1289-1297.
Bachiller, E., Skaret, G., Nøttestad, L., and Slotte, A. 2016. Feeding Ecology of Northeast Atlantic Mackerel, Norwegian Spring-Spawning Herring and Blue Whiting in the Norwegian Sea. Plos One, 11: e0149238.
Bachiller, E., Utne, K. R., Jansen, T., and Huse, G. 2018. Bioenergetics modeling of the annual consumption of zooplankton by pelagic fish feeding in the Northeast Atlantic. Plos One, 13: e0190345.
Balazy, K., Boehnke, R., Trudnowska, E., Søreide, J. E., and Błachowiak-Samołyk, K. 2021. Phenology of Oithona similis demonstrates that ecological flexibility may be a winning trait in the warming Arctic. Scientific Reports, 11: 18599.
Barrett, R. T., Anker-Nilssen, T., Gabrielsen, G. W., and Chapdelaine, G. 2002. Food consumption by seabirds in Norwegian waters. Ices Journal of Marine Science, 59: 43-57.
Baudron, A. R., Brunel, T., Blanchet, M.-A., Hidalgo, M., Chust, G., Brown, E. J., Kleisner, K. M., et al. 2020. Changing fish distributions challenge the effective management of European fisheries. Ecography, 43: 494-505.
Baumgartner, T. R., Soutar, A., and Ferreirabartrina, V. 1992. Reconstruction of the history of pacific sardine and northern anchovy populations over the past 2 millienia from sediments of the Santa-Barbara Basin, California. California Cooperative Oceanic Fisheries Investigations Reports, 33: 24-40.
Beaugrand, G. 2005. Monitoring pelagic ecosystems using plankton indicators. Ices Journal of Marine Science, 62: 333-338.
Beaugrand, G., Brander, K. M., Lindley, J. A., Souissi, S., and Reid, P. C. 2003. Plankton effect on cod recruitment in the North Sea. Nature, 426: 661-664.
Beaugrand, G., Ibañez, F., Lindley, J. A., and Reid, P. C. 2002a. Diversity of calanoid copepods in the North Atlantic and adjacent seas: species associations and biogeography. Mar. Ecol. Prog. Ser., 232: 179-195.
Beaugrand, G., Luczak, C., and Edwards, M. 2009. Rapid biogeographical plankton shifts in the North Atlantic Ocean. Global Change Biology, 15: 1790-1803.
Beaugrand, G., Reid, P. C., Ibañez, F., Lindley, J. A., and Edwards, M. 2002b. Reorganization of North Atlantic Marine Copepod Biodiversity and Climate. Science, 296: 1692-1694.
Bedford, J., Johns, D., and McQuatters-Gollop, A. 2018. A century of change in North Sea plankton communities explored through integrating historical datasets. Ices Journal of Marine Science, 76: 104-112.
Behrenfeld, M. J., and Falkowski, P. G. 1997. Photosynthetic rates derived from satellite-based chlorophyll concentration. Limnology and Oceanography, 42: 1-20.
Bjørdal, V. D., Mørk, H. L., Utne, K. R., Fernö, A., and Nøttestad, L. 2022. The diet of juvenile Atlantic mackerel (Scomber scombrus) feeding in new northern nursery areas along the Norwegian coast. Provisionally accepted. Marine Biology Research.
Blindheim, J. 2004. Oceanography and climate. In The Norwegian Sea Ecosystem, pp. 65–96. Ed. by H. Skjoldal. Tapir Academic Press, Trondheim.
Blindheim, J., Borovkov, V., Hansen, B., Malmberg, S. A., Turrell, W. R., and Østerhus, S. 2000. Upper layer cooling and freshening in the Norwegian Sea in relation to atmospheric forcing. Deep Sea Research Part I: Oceanographic Research Papers, 47: 655-680.
Boyd, R. J., Sibly, R., Hyder, K., Walker, N., Thorpe, R., and Roy, S. 2020. Simulating the summer feeding distribution of Northeast Atlantic mackerel with a mechanistic individual-based model. Progress in Oceanography, 183: 102299.
Bringedal, C., Eldevik, T., Skagseth, Ø., Spall, M. A., and Østerhus, S. 2018. Structure and Forcing of Observed Exchanges across the Greenland–Scotland Ridge. Journal of Climate, 31: 9881-9901.
Brody, S. R., Lozier, M. S., and Dunne, J. P. 2013. A comparison of methods to determine phytoplankton bloom initiation. Journal of Geophysical Research: Oceans, 118: 2345-2357.
Broms, C., and Melle, W. 2007. Seasonal development of Calanus finmarchicus in relation to phytoplankton bloom dynamics in the Norwegian Sea. Deep Sea Research Part II: Topical Studies in Oceanography, 54: 2760-2775.
Broms, C., Melle, W., and Horne, J. K. 2012. Navigation mechanisms of herring during feeding migration: the role of ecological gradients on an oceanic scale. Marine Biology Research, 8: 461-474.
Broms, C., Melle, W., and Kaartvedt, S. 2009. Oceanic distribution and life cycle of Calanus species in the Norwegian Sea and adjacent waters. Deep Sea Research Part II: Topical Studies in Oceanography, 56: 1910-1921.
Broms, C., Strand, E., Utne, K. R., Hjøllo, S., Sundby, S., and Melle, W. 2016. Vitenskapelig bakgrunnsmateriale for forvaltningsplan for raudåte. Fisken og Havet Rapport 8-2016 (in Norwegian with English Abstract).
Browman, H. I. 2016. Applying organized scepticism to ocean acidification research Introduction. Ices Journal of Marine Science, 73: 529-536.
Brown, L., Sanders, R., Savidge, G., and Lucas, C. H. 2003. The uptake of silica during the spring bloom in the Northeast Atlantic Ocean. Limnology and Oceanography, 48: 1831-1845.
Bruge, A., Alvarez, P., Fontán, A., Cotano, U., and Chust, G. 2016. Thermal Niche Tracking and Future Distribution of Atlantic Mackerel Spawning in Response to Ocean Warming. Frontiers in Marine Science, 3.
Brun, E. 1979. Present status and trends in populations of seabirds in Norway. In Conservation of Marine Birds of Northern North America. Fisheries and Wildlife Service Research Report, 11., pp. 289-301. Ed. by J. C. Bartonek, and D. N. Nettleship.
Brun, P., Payne, M. R., and Kiørboe, T. 2017. A trait database for marine copepods. Earth Syst. Sci. Data, 9: 99-113.
Brunel, T., Damme, C., Samson, M., and Dickey-Collas, M. 2017. Quantifying the influence of geography and environment on the northeast Atlantic mackerel spawning distribution. Fisheries Oceanography, 27.
Castellani, C., Licandro, P., Fileman, E., di Capua, I., and Mazzocchi, M. G. 2015. Oithona similis likes it cool: evidence from two long-term time series. Journal of Plankton Research, 38: 703-717.
Chassot, E., Bonhommeau, S., Dulvy, N. K., Mélin, F., Watson, R., Gascuel, D., and Le Pape, O. 2010. Global marine primary production constrains fisheries catches. Ecology Letters, 13: 495-505.
Chassot, E., Mélin, F., Le Pape, O., and Gascuel, D. 2007. Bottom-up control regulates fisheries production at the scale of eco-regions in European seas. Marine Ecology Progress Series, 343: 45-55.
Chierici, M., I. Skjelvan, I., Norli, M., Lødemel, H. H., Lunde, L. F., Børsheim, K. Y., Sørensen, K., et al. 2016. Overvåking av havforsuring i norske farvann i 2015, Rapport, Miljødirektoratet, M-354|2016.
Chierici, M., Skjelvan, I., Norli, M., Jones, E., Børsheim, K. Y., Lauvset, S. K., Lødemel, H. H., et al. 2017. Overvåking av havforsuring i norske farvann i 2016, Rapport, Miljødirektoratet, M-776|2017.
Christensen-Dalsgaard, S., May, R., Barrett, R., Langset, M., Sandercock, B., and Lorentsen, S.-H. 2018. Prevailing weather conditions and diet composition affect chick growth and survival in the black-legged kittiwake.
Comeau, S., Carpenter, R. C., and Edmunds, P. J. 2013. Coral reef calcifiers buffer their response to ocean acidification using both bicarbonate and carbonate. Proceedings of the Royal Society B: Biological Sciences, 280: 20122374.
Continuous Plankton Recorder Survey 2022.
Copernicus Marine Services. 2021. Copernicus Marine Services.
Cury, P. M., Boyd, I. L., Bonhommeau, S., Anker-Nilssen, T., Crawford, R. J. M., Furness, R. W., Mills, J. A., et al. 2011. Global Seabird Response to Forage Fish Depletion—One-Third for the Birds. Science, 334: 1703-1706.
Dalpadado, P., Ellertsen, B., Melle, W., and Dommasnes, A. 2000. Food and feeding conditions of Norwegian spring-spawning herring (Clupea harengus) through its feeding migrations. Ices Journal of Marine Science, 57: 843-857.
Dalpadado, P., Ellertsen, B., Melle, W., and Skjoldal, H. R. 1998. Summer distribution patterns and biomass estimates of macrozooplankton and micronekton in the Nordic Seas. Sarsia, 83: 103-116.
Daufresne, M., Lengfellner, K., and Sommer, U. 2009. Global warming benefits the small in aquatic ecosystems. Proceedings of the National Academy of Sciences, 106: 12788-12793.
Dickson, R. R., Meincke, J., Malmberg, S.-A., and Lee, A. J. 1988. The “great salinity anomaly” in the Northern North Atlantic 1968–1982. Progress in Oceanography, 20: 103-151.
Direktoratsguppen vanndirektivet 2018. Veileder 02:2018 Klassifisering av miljøtilstand i vann.
Dobson, A., Lafferty, K. D., Kuris, A. M., Hechinger, R. F., and Jetz, W. 2008. Homage to Linnaeus: How many parasites? How many hosts? Proceedings of the National Academy of Sciences, 105: 11482-11489.
Dolgov, A. V., Johannesen, E., Heino, M., and Olsen, E. 2009. Trophic ecology of blue whiting in the Barents Sea. Ices Journal of Marine Science, 67: 483-493.
Dommasnes, A., Melle, W., Dalpadado, P., and Ellertsen, B. 2004. Herring as a majorconsumer in the Norwegian Sea. Ices Journal of Marine Science, 61: 739-751.
dos Santos Schmidt, T. C., Slotte, A., Olafsdottir, A. H., Nøttestad, L., Jansen, T., Jacobsen, J. A., í Homrum, E., et al. In prep. Atlantic mackerel (Scomber scombrus) migrates farther north to spawn under the current warm climate scenario.
Dragesund, O. 1970. Factors influencing year-class strength of Norwegian spring spawning herring (Clupea harengus Linne). FiskDir. Skr. Ser. Havunders, 15: 381-450.
Dragesund, O., Østvedt, O. J., and Toresen, R. 2008. Norwegian spring-spawning herring: history of fisheries, biology and stock assessment. In Norwegian Spring-spawning Herring & Northeast Arctic Cod. 100 Years of Research and Management, pp. 41-82. Ed. by O. Nakken. Tapir Academic Press, Trondheim, Norway.
Duarte, C. M., Chapuis, L., Collin, S. P., Costa, D. P., Devassy, R. P., Eguiluz, V. M., Erbe, C., et al. 2021. The soundscape of the Anthropocene ocean. Science, 371: eaba4658.
Dupont, N., Bagoien, E., and Melle, W. 2017. Inter-annual variability in spring abundance of adult Calanus finmarchicus from the overwintering population in the southeastern Norwegian Sea. Progress in Oceanography, 152: 75-85.
Dupont, S., and Pörtner, H.-O. 2013. A snapshot of ocean acidification research. Marine Biology, 160: 1765-1771.
Durant, J. M., Anker-Nilssen, T., Hjermann, D. Ø., and Stenseth, N. C. 2004. Regime shifts in the breeding of an Atlantic puffin population. Ecology Letters, 7: 388-394.
Durant, J. M., Anker-Nilssen, T., and Stenseth, N. C. 2003. Trophic interactions under climate fluctuations: the Atlantic puffin as an example. Proc Biol Sci, 270: 1461-1466.
Durant, J. M., Molinero, J.-C., Ottersen, G., Reygondeau, G., Stige, L. C., and Langangen, Ø. 2019. Contrasting effects of rising temperatures on trophic interactions in marine ecosystems. Scientific Reports, 9: 15213.
Edwards, M., and Richardson, A. J. 2004. Impact of climate change on marine pelagic phenology and trophic mismatch. Nature, 430: 881-884.
EFESE. 2020. l’Évaluation française des écosystèmes et des services écosystémiques [French assessment of ecosystems and ecosystems services]. on 29 March 2022.
Egge, J. K., and Aksnes, D. L. 1992. Silicate as regulating nutrient in phytoplankton competition. Marine Ecological Progress Series, 83: 281-289.
Ellertsen, B., Moksness, E., Solemdal, P., Stroemme, T., and Tilseth, S. 1977. Vertical distribution and feeding of cod larvae in relation to occurrence and size of prey organisms. ICES Council Meeting documents. 31. ICES, Copenhagen (Denmark), 0, 1977.
Eriksen, E., Gjøsæter, H., Prozorkevich, D., Shamray, E., Dolgov, A., Skern-Mauritzen, M., Stiansen, J. E., et al. 2018. From single species surveys towards monitoring of the Barents Sea ecosystem. Progress in Oceanography, 166: 4-14.
Evans, L. E., Hirst, A. G., Kratina, P., and Beaugrand, G. 2020. Temperature-mediated changes in zooplankton body size: large scale temporal and spatial analysis. Ecography, 43: 581-590.
Fauchald, P., Anker-Nilssen, T., Barrett, R. T., Bustnes, J. O., Bårdsen, B. J., Christensen-Dalsgaard, S., Descamps, S., et al. 2015. The status and trends of seabirds breeding in Norway and Svalbard. Norwegian Institute for Nature research, NINA Report 1151. 84 pp.
Fauchald, P., Tarroux, A., Amélineau, F., Bråthen, V., Descamps, S., Ekker, M., Helgason, H., et al. 2021. Year-round distribution of Northeast Atlantic seabird populations: Applications for population management and marine spatial planning. Marine Ecology Progress Series.
Fiksen, Ø., and Slotte, A. 2002. Stock environment recruitment models for Norwegian spring spawning herring (Clupea harengus). Canadian Journal of Fisheries and Aquatic Sciences, 59: 211-217.
Fransner, F., Fröb, F., Tjiputra, J., Goris, N., Lauvset, S. K., Skjelvan, I., Jeansson, E., et al. 2022. Acidification of the Nordic Seas. Biogeosciences, 19: 979-1012.
Frantzen, S., Boitsov, S., Dehnhard, N., Duinker, A., Grøsvik, B. E., Heimstad, E., Hjermann, D., et al. 2022. Forurensning i de norske havområdene - Barentshavet, Norskehavet og Nordsjøen (Pollution in the Norwegian sea areas - Barents Sea, Norwegian Sea and North Sea). Rapport fra havforskningen nr. 2022-3.
Frölicher, T. L., Fischer, E. M., and Gruber, N. 2018. Marine heatwaves under global warming. Nature, 560: 360-364.
Garcia, H. E., and Levitus, S. 2006. World ocean atlas 2005. Vol. 4, Nutrients (phosphate, nitrate, silicate).
Garcia, T., Planque, B., Arneberg, P., Bogstad, B., Skagseth, Ø., and Tiedemann, M. 2020. An appraisal of the drivers of Norwegian spring-spawning herring (Clupea harengus) recruitment. Fisheries Oceanography, 30: 159-173.
Gislason, A., and Astthorsson, O. S. 2002. The food of Norwegian spring-spawning herring in the western Norwegian Sea in relation to the annual cycle of zooplankton. Sarsia, 87: 236-247.
Gíslason, D., Helyar, S. J., Óskarsson, G. J., Ólafsdóttir, G., Slotte, A., Jansen, T., Jacobsen, J. A., et al. 2020. The genetic composition of feeding aggregations of the Atlantic mackerel (Scomber scombrus) in the central north Atlantic: a microsatellite loci approach. Ices Journal of Marine Science, 77: 604-612.
Gjøsæter, H., and Bogstad, B. 1998. Effects of the presence of herring (Clupea harengus) on the stock-recruitment relationship of Barents Sea capelin (Mallotus villosus). Fisheries Research, 38: 57-71.
Gjøsæter, H., Bogstad, B., and Tjelmeland, S. 2009. Ecosystem effects of the three capelin stock collapses in the Barents Sea. Marine Biology Research, 5: 40-53.
Gjøsæter, H., Melle, W., Bogstad, B., Dalpadado, P., Holst, J. C., Huse, G., I., R., et al. 2011. Is there little food in the ocean for our fish stocks? Havforskningsrapporten 2011, 2011 Bergen Fisken og havet, Særnr. 1 (pg. 100-107) 171 pp (in Norwegian).
Goberville, E., Beaugrand, G., and Edwards, M. 2014. Synchronous response of marine plankton ecosystems to climate in the Northeast Atlantic and the North Sea. Journal of Marine Systems, 129: 189-202.
Gorokhova, E., Lehtiniemi, M., Lesutiene, J., Strake, S., Uusitalo, L., Demereckiene, N., and Amid, C. 2013. Zooplankton mean size and total abundance. HELCOM Core indicator Report. ICES Document December.
Grémillet, D., Ponchon, A., Paleczny, M., Palomares, M.-L. D., Karpouzi, V., and Pauly, D. 2018. Persisting Worldwide Seabird-Fishery Competition Despite Seabird Community Decline. Current Biology, 28: 4009-4013.e4002.
Gundersen, e. a. 2020. Declining silicate and nitrate concentrations in the northern North Atlantic. Published manuscript.
Hansen, C., Hjøllo, S. S., Ottersen, G., and Skern-Mauritzen, M. 2022. Miljøverdiers sårbarhet i norske havområder. Rapport fra havforskningen nr. 2022-33.
Hansen, C., Skogen, M. D., Rong Utne, K., Broms, C., Strand, E., and Sætre Hjøllo, S. 2021a. Patterns, efficiency and ecosystem effects when fishing Calanus finmarchicus in the Norwegian Sea—using an individual-based model. Marine Ecology Progress Series, 680: 15-32.
Hansen, E. S., Sandvik, H., Erikstad, K. E., Yoccoz, N. G., Anker-Nilssen, T., Bader, J., Descamps, S., et al. 2021b. Centennial relationships between ocean temperature and Atlantic puffin production reveal shifting decennial trends. Global Change Biology, 27: 3753-3764.
Hardison, S., Perretti, C. T., DePiper, G. S., and Beet, A. 2019. A simulation study of trend detection methods for integrated ecosystem assessment. Ices Journal of Marine Science.
Hatun, H., Azetsu-Scott, K., Somavilla, R., Rey, F., Johnson, C., Mathis, M., Mikolajewicz, U., et al. 2017. The subpolar gyre regulates silicate concentrations in the North Atlantic. Scientific Reports, 7.
Hátún, H., Payne, M. R., Beaugrand, G., Reid, P. C., Sandø, A. B., Drange, H., Hansen, B., et al. 2009. Large bio-geographical shifts in the north-eastern Atlantic Ocean: From the subpolar gyre, via plankton, to blue whiting and pilot whales. Progress in Oceanography, 80: 149-162.
Hatun, H., Payne, M. R., and Jacobsen, J. A. 2009. The North Atlantic subpolar gyre regulates the spawning distribution of blue whiting (Micromesistius poutassou). Canadian Journal of Fisheries and Aquatic Sciences, 66: 759-770.
Hatun, H., Sando, A. B., Drange, H., Hansen, B., and Valdimarsson, H. 2005. Influence of the Atlantic subpolar gyre on the thermohaline circulation. Science, 309: 1841-1844.
Hébert, M.-P., Beisner, B. E., and Maranger, R. 2016. Linking zooplankton communities to ecosystem functioning: toward an effect-trait framework. Journal of Plankton Research, 39: 3-12.
Heinänen, S., Chudzinska, M. E., Brandi Mortensen, J., Teo, T. Z. E., Rong Utne, K., Doksæter Sivle, L., and Thomsen, F. 2018. Integrated modelling of Atlantic mackerel distribution patterns and movements: A template for dynamic impact assessments. Ecological Modelling, 387: 118-133.
HELCOM. 2018. Zooplankton mean size and total stock. HELCOM core indicator report. ISSN 2343-2543 [Accessed: Dec 2020].
Helland-Hansen, B., and Nansen, F. 1909. The Norwegian Sea. Its physical oceanography based upon the Norwegian Researches 1900–1904. Report on Norwegian Fishery and Marine Investigations, 2: 1–360.
Hennige, S. J., Wicks, L. C., Kamenos, N. A., Perna, G., Findlay, H. S., and Roberts, J. M. 2015. Hidden impacts of ocean acidification to live and dead coral framework. Proceedings of the Royal Society B: Biological Sciences, 282: 20150990.
Hipfner, J. M., Blight, L. K., Lowe, R. W., Wilhelm, S. I., Robertson, G. J., Barrett, R. T., Anker-Nilssen, T., et al. 2012. Unintended consequences: how the recovery of sea eagle Haliaeetus spp. populations in the northern hemisphere is affecting seabirds. Marine Ornithology, 40: 39-52.
Hirche, H.-J. 1991. Distribution of dominant calanoid copepod species in the Greenland sea during late fall. Polar Biology, 11: 351-362.
Hjermann, D. O., Ottersen, G., and Stenseth, N. C. 2004. Competition among fishermen and fish causes the collapse of Barents Sea capelin. Proceedings of the National Academy of Sciences of the United States of America, 101: 11679-11684.
Hjøllo, S. S., Hansen, C., and Skogen, M. D. 2021. Assessing the importance of zooplankton sampling patterns with an ecosystem model. Marine Ecology Progress Series, dynmod: DYNMODav3.
Holst, J. C., Røttingen, I., and Melle, W. 2004. The herring. In The Norwegian Sea ecosystem, pp. 223-226. Ed. by H. R. Skjoldal. Tapir Academic Press, Trondheim, Norway.
Homrum, E., Oskarsson, G. J., Ono, K., Hølleland, S., and Slotte, A. 2022. Changes towards stable good somatic condition and increased gonad investment of Norwegian spring-spawning herring (Clupea harengus) after 2005 are linked to extended feeding period. Frontiers
Huse, G. 2016. A spatial approach to understanding herring population dynamics. Canadian Journal of Fisheries and Aquatic Sciences, 73: 177-188.
Huse, G., Holst, J. C., Utne, K., Nottestad, L., Melle, W., Slotte, A., Ottersen, G., et al. 2012. Effects of interactions between fish populations on ecosystem dynamics in the Norwegian Sea - results of the INFERNO project Preface. Marine Biology Research, 8: 415-419.
Häkkinen, S., and Rhines, P. B. 2004. Decline of Subpolar North Atlantic Circulation During the 1990s. Science, 304: 555-559.
ICES. 1997. Database report of the Stomach Sampling project 1991. ICES Cooperative Research Report No. 219. pp. 422. ices.pub.4626.
ICES. 2009a. Report of the planning group for pelagic ecosystem surveys (PGNAPES) ICES 2009 RMC:06.
ICES. 2009b. Report of the Workshop on Blue Whiting Recruitment (WKBLUR) ICES CM 2009/RMC:09.
ICES. 2014a. Final Report to OSPAR of the Joint OSPAR/ICES Ocean Acidification Study Group (SGOA). ICES CM 2014/ACOM:67. 141 pp.
ICES. 2014b. First Interim Report of the Stock Identification Methods Working Group (SIMWG), by correspondence. ICES CM 2014/SSGSUE:02. 31 pp.
ICES. 2019a. Report of the Working Group on Integrated Ecosystem Assessments for the Norwegian Sea (WGINOR). ICES WGINOR REPORT 2018 26-30 November 2018. Reykjavik, Iceland. ICES CM 2018/IEASG:10. 123 pp.
ICES 2019b. Working Group on Mackerel and Horse Mackerel Egg Surveys (WGMEGS). ICES Scientific Reports. 1:66. 233. 233.
ICES. 2020. Manual for the North Sea International Bottom Trawl Surveys. Series of ICES Survey Protocols SISP 10-IBTS 10, Revision 11. 102 pp.
ICES. 2021a. Cruise report from the International Ecosystem Survey in the Nordic Seas (IESNS) in April - May 2021. Working Document to ICES Working Group on Widely Distributed Stocks (WGWIDE, No. 09), ICES HQ, Copenhagen, Denmark, (digital meeting) 25.-31. August 2021, 29 pp.
ICES. 2021b. ICES Advice on fishing opportunities, catch, and effort. Mackerel (Scomber scombrus) in subareas 1–8 and 14, and in Division 9.a (Northeast Atlantic and adjacent waters).
ICES. 2022a. Blue whiting (Micromesistius poutassou) in subareas 1–9, 12, and 14 (Northeast Atlantic and adjacent waters).
ICES. 2022b. Herring (Clupea harengus) in subareas 1, 2, and 5, and in divisions 4.a and 14.a, Norwegian spring-spawning herring (Northeast Atlantic and Arctic Ocean).
ICES. 2022c. Mackerel (Scomber scombrus) in subareas 1–8 and 14, and in Division 9.a (Northeast Atlantic and adjacent waters).
ICES. 2022d. Working Group on the Integrated Assessments of the Norwegian Sea (WGINOR; outputs from 2021 meeting). ICES Scientific Reports. 4:35. 48pp.
IPCC. 2021. Summary for Policymakers. In: Climate Change 2021: The Physical Science Basis. Contribution of Working Group I to the Sixth Assessment Report of the Intergovernmental Panel on Climate Change [Masson-Delmotte, V., P. Zhai, A. Pirani, S.L. Connors, C. Péan, S. Berger, N. Caud, Y. Chen, L. Goldfarb, M.I. Gomis, M. Huang, K. Leitzell, E. Lonnoy, J.B.R. Matthews, T.K. Maycock, T. Waterfield, O. Yelekçi, R. Yu, and B. Zhou (eds.)]. Cambridge University Press, Cambridge, United Kingdom and New York, NY, USA, pp. 3−32, doi:10.1017/9781009157896.001.
Iversen, S. A. 2002. Changes in the perception of the migration pattern of Northeast Atlantic mackerel during the last 100 years. ICES Marine Science Symposia 215: 382-390.
Iverson, R. L. 1990. Control of marine fish production. Limnology and Oceanography, 35: 1593-1604.
Jakobsson, S., Evju, M., Framstad, E., Imbert, A., Lyngstad, A., Sickel, H., Sverdrup-Thygeson, A., et al. 2021. Introducing the index-based ecological condition assessment framework (IBECA). Ecological Indicators, 124: 107252.
Jansen, T. 2013. Pseudocollapse and rebuilding of North Sea mackerel (Scomber scombrus). Ices Journal of Marine Science, 71: 299-307.
Jansen, T., Campbell, A., Kelly, C., Hátún, H., and Payne, M. R. 2012. Migration and Fisheries of North East Atlantic Mackerel (Scomber scombrus) in Autumn and Winter. Plos One, 7: e51541.
Jansen, T., and Gislason, H. 2013. Population Structure of Atlantic Mackerel (Scomber scombrus). Plos One, 8: e64744.
Jansen, T., Kristensen, K., van der Kooij, J., Post, S., Campbell, A., Utne, K. R., Carrera, P., et al. 2015. Nursery areas and recruitment variation of Northeast Atlantic mackerel (Scomber scombrus). Ices Journal of Marine Science, 72: 1779-1789.
Jansen, T., Post, S., Kristiansen, T., Óskarsson, G. J., Boje, J., MacKenzie, B. R., Broberg, M., et al. 2016. Ocean warming expands habitat of a rich natural resource and benefits a national economy. Ecol Appl, 26: 2021-2032.
Jansen, T., Slotte, A., Christina dos Santos Schmidt, T., Reedtz Sparrevohn, C., Arge Jacobsen, J., and Sigurd Kjesbu, O. 2021. Bioenergetics of egg production in Northeast Atlantic mackerel changes the perception of fecundity type and annual trends in spawning stock biomass. Progress in Oceanography, 198: 102658.
Jepsen, J. U., Arneberg, P., Ims, R. A., Siwertsson, A., and Yoccoz, N. G. 2019. Test av fagsystemet for økologisk tilstand. Erfaringer fra pilotprosjekter for arktisk tundra og arktisk del av Barentshavet. NINA Rapport 1674. Norsk institutt for naturforskning.
Jepsen, J. U., Arneberg, P., Ims, R. A., Siwertsson, A., and Yoccoz, N. G. 2020. Panel-based Assessment of Ecosystem Condition (PAEC). Technical protocol version 2. NINA Report 1890.
Jepsen, J. U., Arneberg, P., Ims, R. A., Siwertsson, A., Yoccoz, N. G., Fauchald, P., Pedersen, Å. Ø., et al. submitted. Beyond accounting – panel-based assessment of ecosystem condition as a platform for adaptive and knowledge driven management. Ecosystems.
John, E. H., Batten, S. D., Harris, R. P., and Hays, G. C. 2001. Comparison between zooplankton data collected by the Continuous Plankton Recorder survey in the English Channel and by WP-2 nets at station L4, Plymouth (UK). Journal of Sea Research, 46: 223-232.
Jones, E., Chierici, M., Skjelvan, I., Norli, M., Børsheim, K. Y., Lauvset, S. K., Lødemel, H. H., et al. 2018. Monitoring Ocean Acidification in Norwegian waters/Overvåking av havforsuring i norske farvann i 2017 Report, Norwegian Environment Agency/Miljødirektoratet, M-1072|2018.
Jones, E., Chierici, M., Skjelvan, I., Norli, M., Frigstad, H., Børsheim, K. Y., Lødemel, H. H., et al. 2020. Monitoring ocean acidification in Norwegian seas in 2019, Rapport, Miljødirektoratet, M-1735|2020.
Kacimi, S., and Kwok, R. 2022. Arctic Snow Depth, Ice Thickness, and Volume From ICESat-2 and Crynat-2: 2018-2021. Geophysical Research Letters, 49.
Kiørboe, T. 2011. How zooplankton feed: mechanisms, traits and trade-offs. Biological Reviews, 86: 311-339.
Kjesbu, O. S., Sundby, S., Sandø, A. B., Alix, M., Hjøllo, Solfrid S., Tiedemann, M., Skern-Mauritzen, M., et al. 2022. Highly mixed impacts of near-future climate change on stock productivity proxies in the North East Atlantic. Fish and Fisheries, 23: 601-615.
Kristiansen, I., Gaard, E., Hatun, H., Jonasdottir, S., and Ferreira, A. S. A. 2016. Persistent shift of Calanus spp. in the southwestern Norwegian Sea since 2003, linked to ocean climate. Ices Journal of Marine Science, 73: 1319-1329.
Kristiansen, I., Hátún, H., Petursdottir, H., Gislason, A., Broms, C., Melle, W., Jacobsen, J. A., et al. 2019. Decreased influx of Calanus spp. into the south-western Norwegian Sea since 2003. Deep Sea Research Part I: Oceanographic Research Papers, 149: 103048.
Kroeker, K. J., Kordas, R. L., Crim, R., Hendriks, I. E., Ramajo, L., Singh, G. S., Duarte, C. M., et al. 2013. Impacts of ocean acidification on marine organisms: quantifying sensitivities and interaction with warming. Global Change Biology, 19: 1884-1896.
Kvadsheim, P. H., Forland, T. N., de Jong, K., Nyqvist, D., Grimsbø, E., and Sivle, L. D. 2020. Effekter av støyforurensning på havmiljø - kunnskapsstatus og forvaltningsrådgiving. FFI-RAPPORT 20/01015.
Kvadsheim, P. H., and Sivle, L. D. 2020. Effekter av seismikk på sjøpattedyr. Sjøpattedyrutvalget, Tromsø, 22.-23. oktober 2020.
Kvadsheim, P. H., Sivle, S. D., Hansen, R. R., and Karlsen, H. E. 2017. Effekter av menneskeskapt støy på havmiljø - rapport til Miljødirektoratet om kunnskapsstatus. FFI-RAPPORT 17/00075.
Kwiatkowski, L., Torres, O., Bopp, L., Aumont, O., Chamberlain, M., Christian, J. R., Dunne, J. P., et al. 2020. Twenty-first century ocean warming, acidification, deoxygenation, and upper-ocean nutrient and primary production decline from CMIP6 model projections. Biogeosciences, 17: 3439-3470.
Lafferty, K. D. 2008. Ecosystem consequences of fish parasites. Journal of Fish Biology, 73: 2083-2093.
Lafferty, K. D., and Kuris, A. M. 2009. Parasites reduce food web robustness because they are sensitive to secondary extinction as illustrated by an invasive estuarine snail. Philosophical Transactions of the Royal Society B-Biological Sciences, 364: 1659-1663.
Landgren, O. A., Seierstad, I. A., and Iversen, T. 2019. Projected future changes in Marine Cold-Air Outbreaks associated with Polar Lows in the Northern North-Atlantic Ocean. Climate Dynamics, 53: 2573-2585.
Langøy, H., Nottestad, L., Skaret, G., Broms, C., and Ferno, A. 2012. Overlap in distribution and diets of Atlantic mackerel (Scomber scombrus), Norwegian spring-spawning herring (Clupea harengus) and blue whiting (Micromesistius poutassou) in the Norwegian Sea during late summer. Marine Biology Research, 8: 442-460.
Lasker, R. 1981. The role of a stable ocean in larval fish survival and subsequent recruitment. In Marine fish larvae, morphology, ecology and relation to fisheries, pp. 80-87. Ed. by R. Lasker. University Washington Press.
Laufkötter, C., Zscheischler, J., and Frölicher, T. L. 2020. High-impact marine heatwaves attributable to human-induced global warming. Science, 369: 1621-1625.
Leonard, D. M., and Øien, N. I. 2020a. Estimated Abundances of Cetacean Species in the Northeast Atlantic from Norwegian Shipboard Surveys Conducted in 2014–2018. NAMMCO Scientific Publications 11. 10.7557/3.4694.
Leonard, D. M., and Øien, N. I. 2020b. Estimated Abundances of Cetaceans Species in the Northeast Atlantic from Two Multiyear Surveys Conducted by Norwegian Vessels between 2002–2013. NAMMCO Scientific Publications 11. 10.7557/3.4695.
Lewandowska, A., and Sommer, U. 2010. Climate change and the spring bloom: a mesocosm study on the influence of light and temperature on phytoplankton and mesozooplankton. Marine Ecology Progress Series, 405: 101-111.
Li, G., Cheng, L., Zhu, J., Trenberth, K. E., Mann, M. E., and Abraham, J. P. 2020. Increasing ocean stratification over the past half-century. Nature Climate Change, 10: 1116-1123.
Lindemann, C., and St. John, M. A. 2014. A seasonal diary of phytoplankton in the North Atlantic. Frontiers in Marine Science, 1.
Longhurst, A. 1998. Ecological Geography of the Sea, Academic Press, Londin.
Makarieva, A. M., Gorshkov, V. G., Sheil, D., Nobre, A. D., and Li, B. L. 2013. Where do winds come from? A new theory on how water vapor condensation influences atmospheric pressure and dynamics. Atmos. Chem. Phys., 13: 1039-1056.
Manno, C., Bednaršek, N., Tarling, G. A., Peck, V. L., Comeau, S., Adhikari, D., Bakker, D. C. E., et al. 2017. Shelled pteropods in peril: Assessing vulnerability in a high CO2 ocean. Earth-Science Reviews, 169: 132-145.
Markowitz, G. 2018. From Industrial Toxins to Worldwide Pollutants: A Brief History of Polychlorinated Biphenyls. Public Health Reports, 133: 721-725.
McGinty, N., Barton, A. D., Record, N. R., Finkel, Z. V., Johns, D. G., Stock, C. A., and Irwin, A. J. 2021. Anthropogenic climate change impacts on copepod trait biogeography. Global Change Biology, 27: 1431-1442.
McNeil, B. I., and Sasse, T. P. 2016. Future ocean hypercapnia driven by anthropogenic amplification of the natural CO2 cycle. Nature, 529: 383-386.
Melle, W., Ellertsen, B., and Skjoldal, H. R. 2004. Zooplankton: The link to higher trophic levels. In The Norwegian Sea Ecosystem, pp. 137-202. Ed. by H. R. Skjoldal. Tapir Academic Press, Trondheim.
Melle, W., Klevjer, T., Strand, E., Wiebe, P. H., Slotte, A., and Huse, G. 2020. Fine-scale observations of physical and biological environment along a herring feeding migration route. Deep Sea Research Part II: Topical Studies in Oceanography, 180: 104845.
Melle, W., Runge, J., Head, E., Plourde, S., Castellani, C., Licandro, P., Pierson, J., et al. 2014. The North Atlantic Ocean as habitat for Calanus finmarchicus: Environmental factors and life history traits. Progress in Oceanography, 129: 244-284.
Michelangeli, M., Martin, J. M., Pinter-Wollman, N., Ioannou, C. C., McCallum, E. S., Bertram, M. G., and Brodin, T. 2022. Predicting the impacts of chemical pollutants on animal groups. Trends in Ecology & Evolution.
Miesner, A. K., and Payne, M. R. 2018. Oceanographic variability shapes the spawning distribution of blue whiting (Micromesistius poutassou). Fisheries Oceanography, 27: 623-638.
Miljøstatus 2022. Lufttilførsler av miljøgifter i Norskehavet.
Ministry of Climate and Environment 2020. Norway's integrated ocean management plans. Barents Sea–Lofoten area; the Norwegian Sea; and the North Sea and Skagerrak. Meld. St. 20 (2019 – 2020) Report to the Storting (white paper). Ed. by N. M. o. C. a. Environment.
Minstry of Climate and Environment. 2015. Nature for life. Norway’s national biodiversity action plan. Meld. St. 14 (2015–2016) Report to the Storting (white paper). Norwegian Ministry of Climate and Environment.
Moore, J. K., Fu, W., Primeau, F., Britten, G. L., Lindsay, K., Long, M., Doney, S. C., et al. 2018. Sustained climate warming drives declining marine biological productivity. Science, 359: 1139-1143.
Morgan, M. G. 2014. Use (and abuse) of expert elicitation in support of decision making for public policy. Proceedings of the National Academy of Sciences, 111: 7176-7184.
Mork, K. A., and Blindheim, J. 2000. Variations in the Atlantic inflow to the Nordic Seas, 1955–1996. Deep Sea Research Part I: Oceanographic Research Papers, 47: 1035-1057.
Mork, K. A., Skagseth, Ø., Ivshin, V., Ozhigin, V., Hughes, S. L., and Valdimarsson, H. 2014. Advective and atmospheric forced changes in heat and fresh water content in the Norwegian Sea, 1951–2010. Geophysical Research Letters, 41: 6221-6228.
Mork, K. A., Skagseth, Ø., and Søiland, H. 2019. Recent Warming and Freshening of the Norwegian Sea Observed by Argo Data. Journal of Climate, 32: 3695-3705.
Mousing, E. A., Planque, B., Arneberg, P., Bjørdal, V. R., Keulder-Stenevik, F., Liebig, P.-L.-., Langøy Mørk, H., et al. Submitted. Quantifying diets for small pelagic fish: Effects of weight vs occurrence methods and sampling effort. ICES J Mar Sci.
Mupepele, A. C., Walsh, J. C., Sutherland, W. J., and Dormann, C. F. 2016. An evidence assessment tool for ecosystem services and conservation studies. Ecological Applications 26: 1295-1301.
NASA 2022. Ice sheets.
Ndah, A. B., Meunier, C. L., Kirstein, I. V., Göbel, J., Rönn, L., and Boersma, M. 2022. A systematic study of zooplankton-based indices of marine ecological change and water quality: Application to the European marine strategy framework Directive (MSFD). Ecological Indicators, 135: 108587.
Nielsen, T. G., and Sabatini, M. 1996. Role of cyclopoid copepods Oithona spp. in North Sea plankton communities. Marine Ecology Progress Series, 139: 79-93.
Nikolioudakis, N., Skaug, H. J., Olafsdottir, A. H., Jansen, T., Jacobsen, J. A., and Enberg, K. 2018. Drivers of the summer-distribution of Northeast Atlantic mackerel (Scomber scombrus) in the Nordic Seas from 2011 to 2017; a Bayesian hierarchical modelling approach. Ices Journal of Marine Science.
Nowacek, D. P., Thorne, L. H., Johnston, D. W., and Tyack, P. L. 2007. Responses of cetaceans to anthropogenic noise. Mammal Review, 37: 81-115.
Nybø, S., and Evju, M. 2017. Fagsystem for fastsetting av god økologisk tilstand. Forslag fra et ekspertråd., p. 247.
Nybø, S., Framstad, E., Jakobsson, S., Evju, M., Lyngstad, A., Sickel, H., Sverdrup-Thygeson, A., et al. 2019. Test av fagsystemet for økologisk tilstand for terrestriske økosystemer i Trøndelag. NINA Rapport 1672. Norsk institutt for naturforskning.
Nøttestad, L., Anthonypillai, V., dos Santos Schmidt, T. C., Høines, Å., Salthaug, A., Ólafsdóttir, A. H., Kennedy, J., et al. 2021. Cruise report from the International Ecosystem Summer Survey in the Nordic Seas (IESSNS) 30th of June – 3rd of August 2021. Working Document to ICES Working Group on Widely Distributed Stocks (WGWIDE, No. 09), ICES HQ, Copenhagen, Denmark, (digital meeting) 25.-31. August 2021, 60 pp.
Nøttestad, L., Utne, K., Óskarsson, G., Jonsson, S. P., Jacobsen, J., Tangen, O., and Anthonypillai, V. 2016. Quantifying changes in abundance, biomass, and spatial distribution of Northeast Atlantic (NEA) mackerel (Scomber scombrus) in the Nordic seas from 2007 to 2014. 359-373 pp.
Olafsdottir, A. H., Slotte, A., Jacobsen, J. A., Oskarsson, G. J., Utne, K. R., and Nøttestad, L. 2015. Changes in weight-at-length and size-at-age of mature Northeast Atlantic mackerel (Scomber scombrus) from 1984 to 2013: effects of mackerel stock size and herring (Clupea harengus) stock size. ICES Journal of Marine Science: Journal du Conseil.
Olafsdottir, A. H., Utne, K. R., Jacobsen, J. A., Jansen, T., Óskarsson, G. J., Nøttestad, L., Elvarsson, B. Þ., et al. 2019. Geographical expansion of Northeast Atlantic mackerel (Scomber scombrus) in the Nordic Seas from 2007 to 2016 was primarily driven by stock size and constrained by low temperatures. Deep Sea Research Part II: Topical Studies in Oceanography, 159: 152-168.
Oliver, E. C. J., Donat, M. G., Burrows, M. T., Moore, P. J., Smale, D. A., Alexander, L. V., Benthuysen, J. A., et al. 2018. Longer and more frequent marine heatwaves over the past century. Nature Communications, 9: 1324.
Olsen, E. M., Melle, W., Kaartvedt, S., Holst, J. C., and Mork, K. A. 2007. Spatially structured interactions between a migratory pelagic predator, the Norwegian spring-spawning herring Clupea harengus L., and its zooplankton prey. Journal of Fish Biology, 70: 799-815.
Ono, K., Slotte, A., Hølleland, S., Mackinson, S., Jónsson, S. Þ., Jacobsen, J. A., and Ólafsdóttir, A. H. 2022. Space-time recapture dynamics of PIT-tagged Northeast Atlantic mackerel (Scomber Scombrus) reveal size-dependent migratory behaviour. Provisionally accepted. Frontiers in Marine Science.
Orvik, K. A. 2022. Long-Term Moored Current and Temperature Measurements of the Atlantic Inflow Into the Nordic Seas in the Norwegian Atlantic Current; 1995–2020. Geophysical Research Letters, 49: e2021GL096427.
Orvik, K. A., and Skagseth, Ø. 2003. Monitoring the Atlantic Inflow to the Norwegian sea by using one moored current meter and one profiling CTD Cont. Shelf Res., 23: 159-176.
Pacariz, S. V., Hatun, H., Jacobsen, J. A., Johnson, C., Eliasen, S., and Rey, F. 2016. Nutrient-driven poleward expansion of the Northeast Atlantic mackerel (Scomber scombrus) stock: A new hypothesis. Elementa-Science of the Anthropocene, 4: 1-13.
Payne, M. R., Danabasoglu, G., Keenlyside, N., Matei, D., Miesner, A. K., Yang, S., and Yeager, S. G. 2022. Skilful decadal-scale prediction of fish habitat and distribution shifts. Nature Communications, 13: 2660.
Payne, M. R., Egan, A., Fässler, S. M. M., Hátún, H., Holst, J. C., Jacobsen, J. A., Slotte, A., et al. 2012. The rise and fall of the NE Atlantic blue whiting (Micromesistius poutassou). Marine Biology Research, 8: 475-487.
Pedersen, A., Alve, E., Alvestad, T., Borgersen, G., Dolven, J. K., Gundersen, H., Hess, S., et al. 2016. Bløtbunnsfauna som indikator for miljøtilstand i kystvann. Ekspertvurderinger og forslag til nye klassegrenser og metodikk. M-633, Miljødirektoratet.
Pedersen, B., Bjerke, J. W., Pedersen, H. C., Brandrud, T. E., Gjershaug, J. O., Hanssen, O., Lyngstad, A., et al. 2018. Naturindeks for Norge – fjell og våtmark. Evaluering av eksisterende indikatorsett, dets datagrunnlag og behovet for ytterligere tilfang av datakilder. NINA Rapport 1462. Norsk institutt for naturforskning.
Pedersen, Å. Ø., Jepsen, J. U., Paulsen, I. M. G., Fuglei, E., Mosbacher, J. B., Ravolainen, V., Yoccoz, N. G., et al. 2021. Norwegian Arctic Tundra: a Panel-based Assessment of Ecosystem Condition. Norwegian Polar Institute Report Series 153. Norwegian Polar Institute, Tromsø.
Perkins-Kirkpatrick, S. E., and Lewis, S. C. 2020. Increasing trends in regional heatwaves. Nature Communications, 11: 3357.
Piatt, J. F., Parrish, J. K., Renner, H. M., Schoen, S. K., Jones, T. T., Arimitsu, M. L., Kuletz, K. J., et al. 2020. Extreme mortality and reproductive failure of common murres resulting from the northeast Pacific marine heatwave of 2014-2016. Plos One, 15: e0226087.
Pinnegar, J. K., Goñi, N., Trenkel, V. M., Arrizabalaga, H., Melle, W., Keating, J., and Óskarsson, G. 2015. A new compilation of stomach content data for commercially important pelagic fish species in the northeast Atlantic. Earth Syst. Sci. Data, 7: 19-28.
Pitois, S. G., Graves, C. A., Close, H., Lynam, C., Scott, J., Tilbury, J., van der Kooij, J., et al. 2021. A first approach to build and test the Copepod Mean Size and Total Abundance (CMSTA) ecological indicator using in-situ size measurements from the Plankton Imager (PI). Ecological Indicators, 123: 107307.
Pitois, S. G., Lynam, C. P., Jansen, T., Halliday, N., and Edwards, M. 2012. Bottom-up effects of climate on fish populations: data from the Continuous Plankton Recorder. Marine Ecology Progress Series, 456: 169-186.
Planque, B., A., F., B., H., Mousing, E., C., H., C., B., U., L., et al. 2022. Quantification of trophic interactions in the Norwegian Sea pelagic food-web over multiple decades. ICES J Mar Sci.
Planque, B., and Fromentin, J. M. 1996. Calanus and environment in the eastern North Atlantic. I. Spatial and temporal patterns of C. finmarchicus and C. helgolandicus. Marine Ecology Progress Series, 134: 101-109.
Planque, B., and Mullon, C. 2020. Modelling chance and necessity in natural systems. Ices Journal of Marine Science, 77: 1573-1588.
Planque, B., Mullon, C., Arneberg, P., Eide, A., Fromentin, J.-M., Heymans, J. J., Hoel, A. H., et al. 2019. A participatory scenario method to explore the future of marine social-ecological systems. Fish and Fisheries, 20: 434-451.
Pope, J., Shepherd, J., and Webb, J. 1995. Successful surf-riding on size spectra: the secret of survival in the sea. Oceanogr. Lit. Rev., 12: 1093.
Pörtner, H.-O., Roberts, D. C., Masson-Delmotte, V., Zhai, P., Tignor, M., Poloczanska, E., Mintenbeck, K., et al. 2019. IPCC Special Report on the Ocean and Cryosphere in a Changing Climate.
R Core Team 2019. R: A Language and Environment for Statistical Computing. R Foundation for Statistical Computing, Vienna, Austria.
Racault, M.-F., Le Quéré, C., Buitenhuis, E., Sathyendranath, S., and Platt, T. 2012. Phytoplankton phenology in the global ocean. Ecological Indicators, 14: 152-163.
Rastrick, S. S. P., Graham, H., Azetsu-Scott, K., Calosi, P., Chierici, M., Fransson, A., Hop, H., et al. 2018. Using natural analogues to investigate the effects of climate change and ocean acidification on Northern ecosystems. Ices Journal of Marine Science, 75: 2299-2311.
Razouls, C., Desreumaux, N., Kouwenberg, J., and de Bovée, F. 2005-2022. Biodiversity of Marine Planktonic Copepods (morphology, geographical distribution and biological data). Sorbonne University, CNRS. [Accessed February 25, 2022].
Record, N. R., Pershing, A. J., and Maps, F. 2012. First principles of copepod development help explain global marine diversity patterns. Oecologia, 170: 289-295.
Rey, F. 2012. Declining silicate concentrations in the Norwegian and Barents Seas. Ices Journal of Marine Science, 69: 208-212.
Richardson, A. J., Walne, A. W., John, A. W. G., Jonas, T. D., Lindley, J. A., Sims, D. W., Stevens, D., et al. 2006. Using continuous plankton recorder data. Progress in Oceanography, 68: 27-74.
Rørvik, C. J., and Jonsgård, Å. 1981. Review of balaenopterids in the North Atlantic Ocean. FAO Fisheries Series, 3: 269-286.
Sandvik, H., Barrett, R. T., Erikstad, K. E., Myksvoll, M. S., Vikebo, F., Yoccoz, N. G., Anker-Nilssen, T., et al. 2016. Modelled drift patterns of fish larvae link coastal morphology to seabird colony distribution. Nature Communications, 7.
Sandø, A. B., Hjøllo, S. S., Hansen, C., Skogen, M. D., Hordoir, R., and Sundby, S. 2022. Risikoanalyse for de norske havområdene om direkte og indirekte virkninger av klimaendringer på marine økosystemer under ulike utslippsscenarier. Rapport fra havforskningen nr. 2022-41.
SEAPOP 2022. SEAPOP. About seabirds - for a richer ocean.
Sheldon, R. W., Prakash, A., and Sutcliffe Jr., W. H. 1972. THE SIZE DISTRIBUTION OF PARTICLES IN THE OCEAN1. Limnology and Oceanography, 17: 327-340.
Siegel, D. A., Doney, S. C., and Yoder, J. A. 2002. The North Atlantic Spring Phytoplankton Bloom and Sverdrup's Critical Depth Hypothesis. Science, 296: 730-733.
Siwertsson, A., Husson, B., Arneberg, P., Assmann, K., Assmy, P., Aune, M., Bogstad, B., et al. Panel-based Assessment of Ecosystem Condition of Norwegian Barents Sea shelf ecosystems. Rapport fra Havforskningen 2022-xx.
Skagseth, O., and Mork, K. A. 2012. Heat content in the Norwegian Sea, 1995-2010. Ices Journal of Marine Science, 69: 826-832.
Skagseth, O., Slotte, A., Stenevik, E. K., and Nash, R. D. M. 2015. Characteristics of the Norwegian Coastal Current during Years with High Recruitment of Norwegian Spring Spawning Herring (Clupea harengus L.). Plos One, 10.
Skagseth, Ø., Broms, C., Gundersen, K., Hátún, H., Kristiansen, I., Larsen, K. M. H., Mork, K. A., et al. 2022. Arctic and Atlantic Waters in the Norwegian Basin, Between Year Variability and Potential Ecosystem Implications. Frontiers in Marine Science, 9.
Skagseth, Ø., Furevik, T., Ingvaldsen, R., Loeng, H., Mork, K. A., Orvik, K. A., and Ozhigin, V. 2008. Volume and heat transports to the Arctic via the Norwegian and Barents Seas, pp. 45-64. In Arctic-Subarctic Ocean Fluxes: Defining the role of the Northern Seas in Climate. Ed. by R. Dickson, R. R. Meincke, and P. Rhines. Springer, Dordrecht, The Netherlands.
Skagseth, Ø., Orvik, K. A., and Furevik, T. 2004. Coherent variability of the Norwegian Atlantic Slope Current derived from TOPEX/ERS altimeter data. Geophysical Research Letters, 31.
Skaret, G., Bachiller, E., Langøy, H., and Stenevik, E. K. 2015. Mackerel predation on herring larvae during summer feeding in the Norwegian Sea. ICES Journal of Marine Science: Journal du Conseil.
Skern-Mauritzen, M., Lindstrøm, U., Biuw, M., Elvarsson, B., Gunnlaugsson, T., Haug, T., Kovacs, K. M., et al. 2022. Marine mammal consumption and fisheries removals in the Nordic and Barents Seas. Ices Journal of Marine Science.
Skjoldal, H. R. e. 2004. The Norwegian Sea Ecosystem, Tapir Academic Press, Trondheim.
Skogen, M. D., Ji, R., Akimova, A., Daewel, U., Hansen, C., Hjøllo, S. S., van Leeuwen, S. M., et al. 2021. Disclosing the truth: Are models better than observations? Marine Ecology Progress Series, 680: 7-13.
Smale, D. A., Wernberg, T., Oliver, E. C. J., Thomsen, M., Harvey, B. P., Straub, S. C., Burrows, M. T., et al. 2019. Marine heatwaves threaten global biodiversity and the provision of ecosystem services. Nature Climate Change, 9: 306-312.
Smith, K. E., Burrows, M. T., Hobday, A. J., King, N. G., Moore, P. J., Gupta, A. S., Thomsen, M. S., et al. 2023. Biological Impacts of Marine Heatwaves. Annual Review of Marine Science, 15: null.
Solvang, H., and Ohishi, M. 2022. trec: An R package for trend estimation and classification to support integrated assessment of the marine ecosystem and environmental factorsarXiv:2209.06619. doi:10.48550/arXiv.2209.06619.
Solvang, H. K., and Planque, B. 2020. Estimation and classification of temporal trends to support integrated ecosystem assessment. Ices Journal of Marine Science, 77: 2529-2540.
Solvang, H. K., Skaug, H. J., and Øien, N. I. 2015. Abundance estimates of common minke whales in the Northeast Atlantic based on survey data collected over the period 2008–2013. Paper SC/66a/RMP8 presented to the Scientific Committee of the International Whaling Commission. Unpublished.
Spall, M. A. 2010. Non-local topographic influences on deep convection: An idealized model for the Nordic Seas. Ocean Modelling, 32: 72-85.
Spall, M. A., Almansi, M., Huang, J., Haine, T. W. N., and Pickart, R. S. 2021. Lateral redistribution of heat and salt in the Nordic Seas. Progress in Oceanography, 196: 102609.
Standal, D. 2006. The rise and decline of blue whiting fisheries—capacity expansion and future regulations. Marine Policy, 30: 315-327.
Strand, E., Bagøien, E., Edwards, M., Broms, C., and Klevjer, T. 2020. Spatial distributions and seasonality of four Calanus species in the Northeast Atlantic. Progress in Oceanography, 185: 102344.
Sverdrup, H. U. 1953. On conditions for the vernal blooming of phytoplankton. J. Conseil perm. int. Explor. Mer., 18: 287-295.
Sætre, R., Toresen, R., and Anker-Nilssen, T. 2002. Factors affecting the recruitment variability of the Norwegian spring-spawning herring (Clupea harengus L.). Ices Journal of Marine Science, 59: 725-736.
The Royal Norwegian Ministry of the Environment. 2006. Integrated Management of the Marine Environment of the Barents Sea and the Sea Areas off the Lofoten Islands. Report No. 8 to the Storting (2005-2006).
Thompson, G. A., Dinofrio, E. O., and Alder, V. A. 2013. Structure, abundance and biomass size spectra of copepods and other zooplankton communities in upper waters of the Southwestern Atlantic Ocean during summer. Journal of Plankton Research, 35: 610-629.
Toresen, R., Skjoldal, H. R., Vikelao, F., and Martinussen, M. B. 2019. Sudden change in long-term ocean climate fluctuations corresponds with ecosystem alterations and reduced recruitment in Norwegian spring-spawning herring (Clupea harengus, Clupeidae). Fish and Fisheries, 20: 686-696.
Toresen, R., and Østvedt, O. J. 2000. Variation in abundance of Norwegian spring-spawning herring (Clupea harengus, Clupeidae) throughout the 20th century and the influence of climatic fluctuations. Fish and Fisheries, 1: 231-256.
Turley, C. M., Roberts, J. M., and Guinotte, J. M. 2007. Corals in deep-water: will the unseen hand of ocean acidification destroy cold-water ecosystems? Coral Reefs, 26: 445-448.
UK Pelagic Habitats Expert Group 2021. Plankton lifeform traits master list (v4:2021-03-17). The Archive for Marine Species and Habitats Data (DASSH). (Dataset).
Utne, K. R., Pauli, B. D., Haugland, M., Jacobsen, J. A., Maoileidigh, N., Melle, W., Broms, C. T., et al. 2021. Poor feeding opportunities and reduced condition factor for salmon post-smolts in the Northeast Atlantic Ocean. Ices Journal of Marine Science, 78: 2844-2857.
Utne, K. R., Skagseth, Ø., Wennevik, V., Broms, C. T., Melle, W., and Thorstad, E. B. 2022. Impacts of a Changing Ecosystem on the Feeding and Feeding Conditions for Atlantic Salmon During the First Months at Sea. Frontiers in Marine Science, 9.
Vollset, K. W., Urdal, K., Utne, K., Thorstad, E. B., Saegrov, H., Raunsgard, A., Skagseth, O., et al. 2022. Ecological regime shift in the Northeast Atlantic Ocean revealed from the unprecedented reduction in marine growth of Atlantic salmon. Science Advances, 8.
Ware, D. M., and Thomson, R. E. 2005. Bottom-up ecosystem trophic dynamics determine fish production in the Northeast Pacific. Science, 308: 1280-1284.
Walsh, P. M., Halley, D. J., Harris, M. P., Del Nevo, A., Sim, I. M. W., and Tasker, M. L. 1995. Seabird monitoring handbook for Britain and Ireland: a compilation of methods for survey and monitoring of breeding seabirds. JNCC/RSPB/ITE/Seabird Group.
Weilgart, L. 2018. The Impact of Ocean Noise Pollution on Fish and Invertebrates. Report for OceanCare, Switzerland.
Wiborg, K. F. 1954. Investigations of Zooplankton in Coastal and Offshore Waters of Western and Northwestern Norway. In Report on Norwegian Fishery and Marine Investigations, Vol. XI. No. 1.
Wolkers, H., Corkeron, P. J., Van Parijs, S. M., Simila, T., and Van Bavel, B. 2007. Accumulation and transfer of contaminants in killer whales (Orcinus orca) from Norway: indications for contaminant metabolism. Environ Toxicol Chem, 26: 1582-1590.
Xu, Z., Ji, F., Liu, B., Feng, T., Gao, Y., He, Y., and Chang, F. 2021. Long-term evolution of global sea surface temperature trend. International Journal of Climatology, 41: 4494-4508.
Yamaguchi, R., Rodgers, K. B., Timmermann, A., Stein, K., Schlunegger, S., Bianchi, D., Dunne, J. P., et al. 2022. Trophic level decoupling drives future changes in phytoplankton bloom phenology. Nature Climate Change, 12: 469-476.
Yamaguchi, R., and Suga, T. 2019. Trend and Variability in Global Upper-Ocean Stratification Since the 1960s. Journal of Geophysical Research: Oceans, 124: 8933-8948.
Øien, N. 2009. Distribution and abundance of large whales in Norwegian and adjacent waters based on ship surveys 1995-2001. NAMMCO Sci. Publ. 7: 31-47.
Østvedt, O. J. 1955. Zooplankton investigations from the Weather ship M in the Norwegian Sea, 1948-1949. Hvalradets Skr, 40: 1-93.